Vulnerability Maps Maps showing the vulnerability of San Diego County residents to the coronavirus, including those related to nursing facilities, homelessness, diabetes, heart disease, and others.
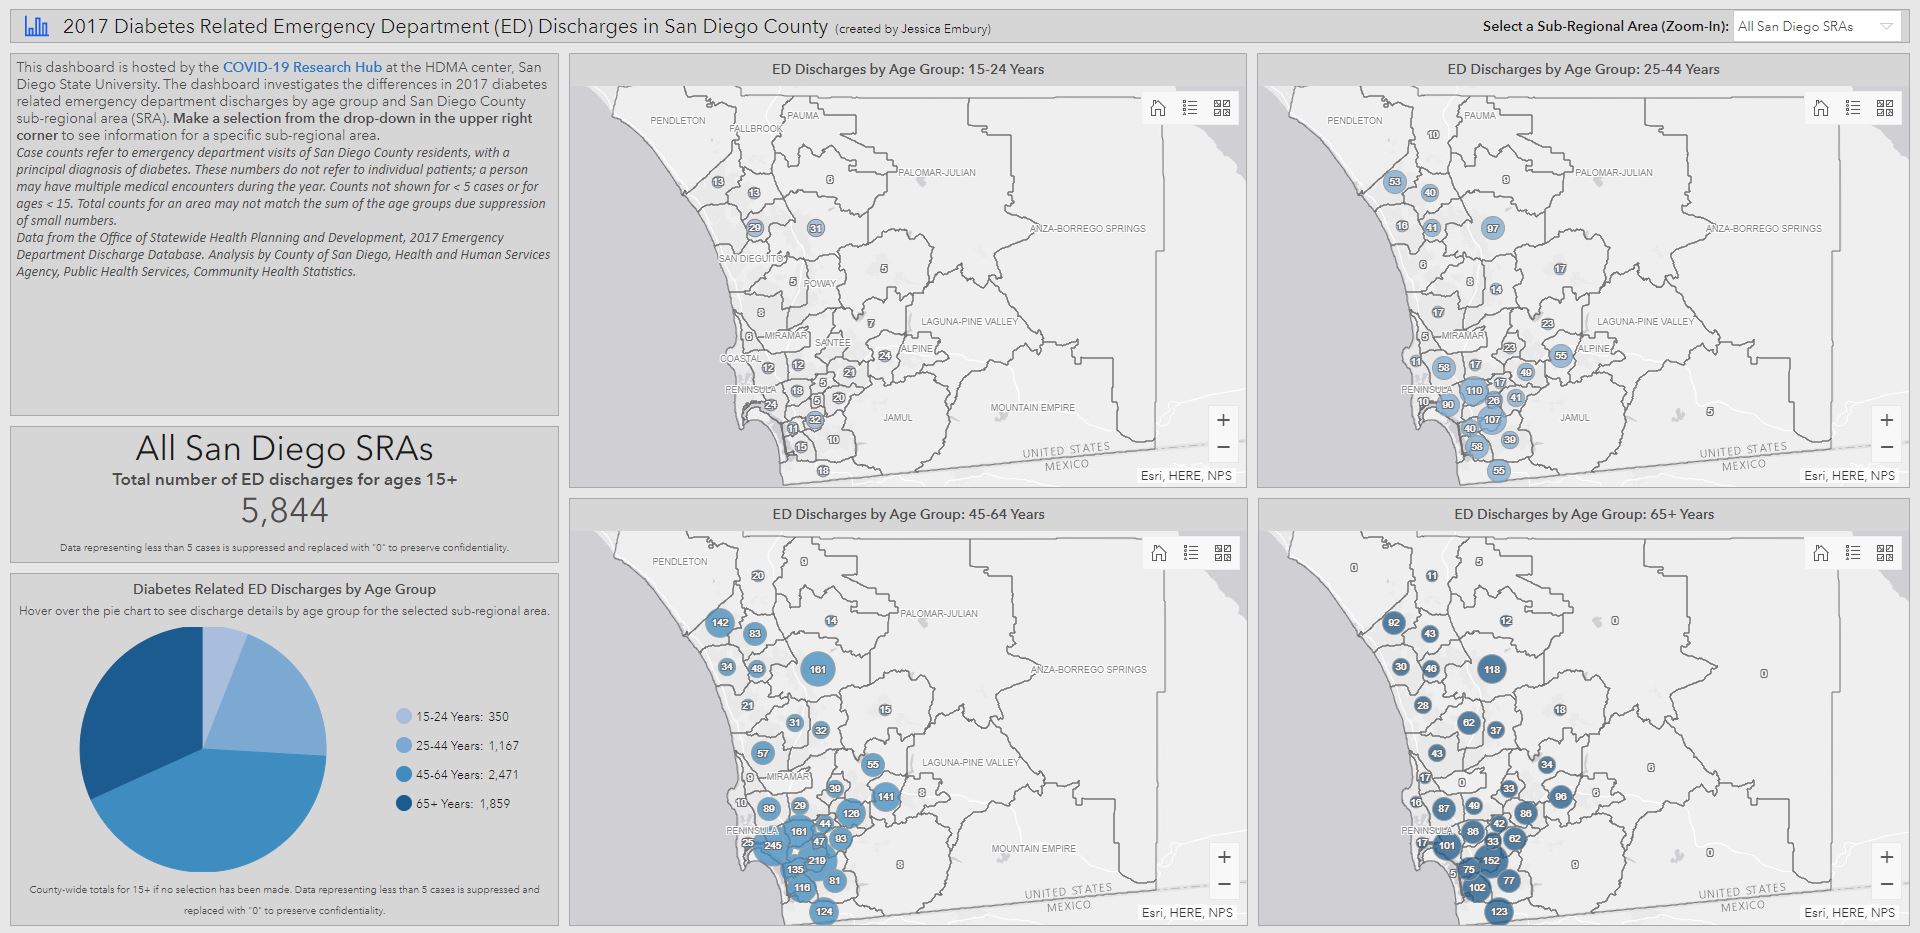
Diabetes Related Emergency Department Discharges in San Diego County
The HDMA center has created a dashboard that looks at the difference in 2017 diabetes related emergency department (ED) discharges by age group in San Diego County. This map was created by Jessica Embury at the HDMA Center.
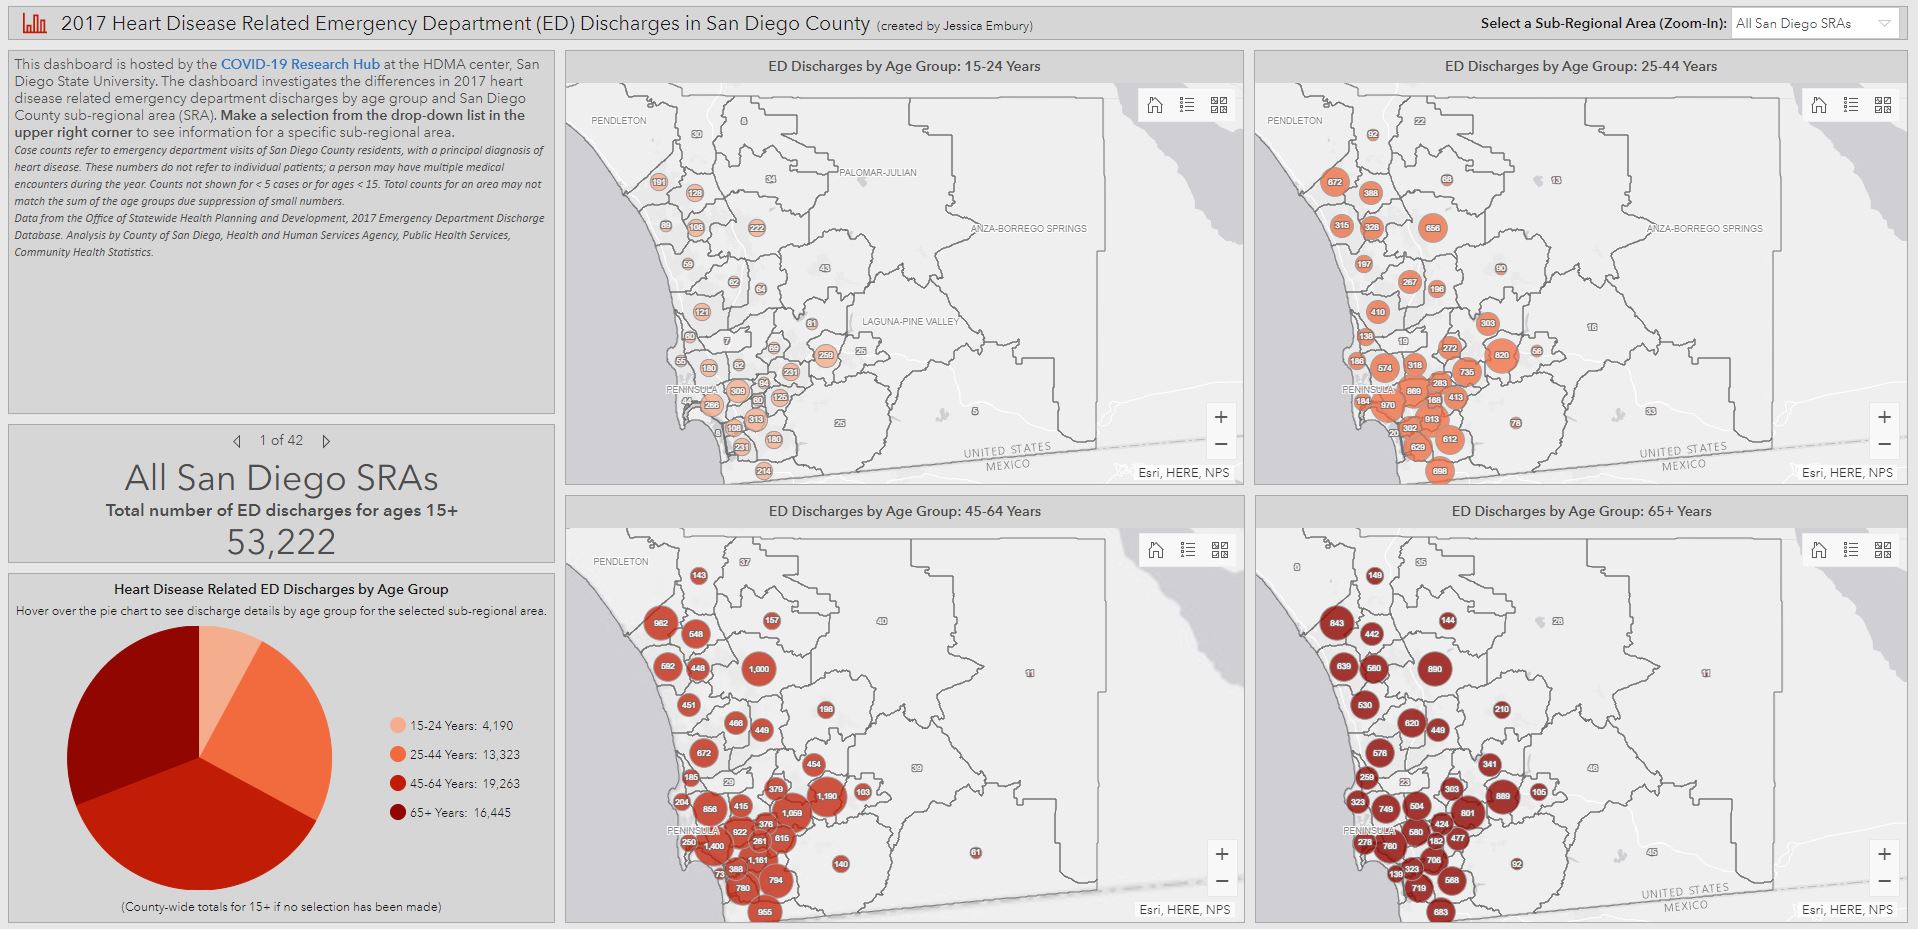
Heart Disease Related Emergency Department Discharges in San Diego County
The HDMA center has created a dahsboard that investigates the difference in 2017 heart disease related emergency department (ED) discharges by age group in San Diego County. This map was created by Jessica Embury at the HDMA Center.
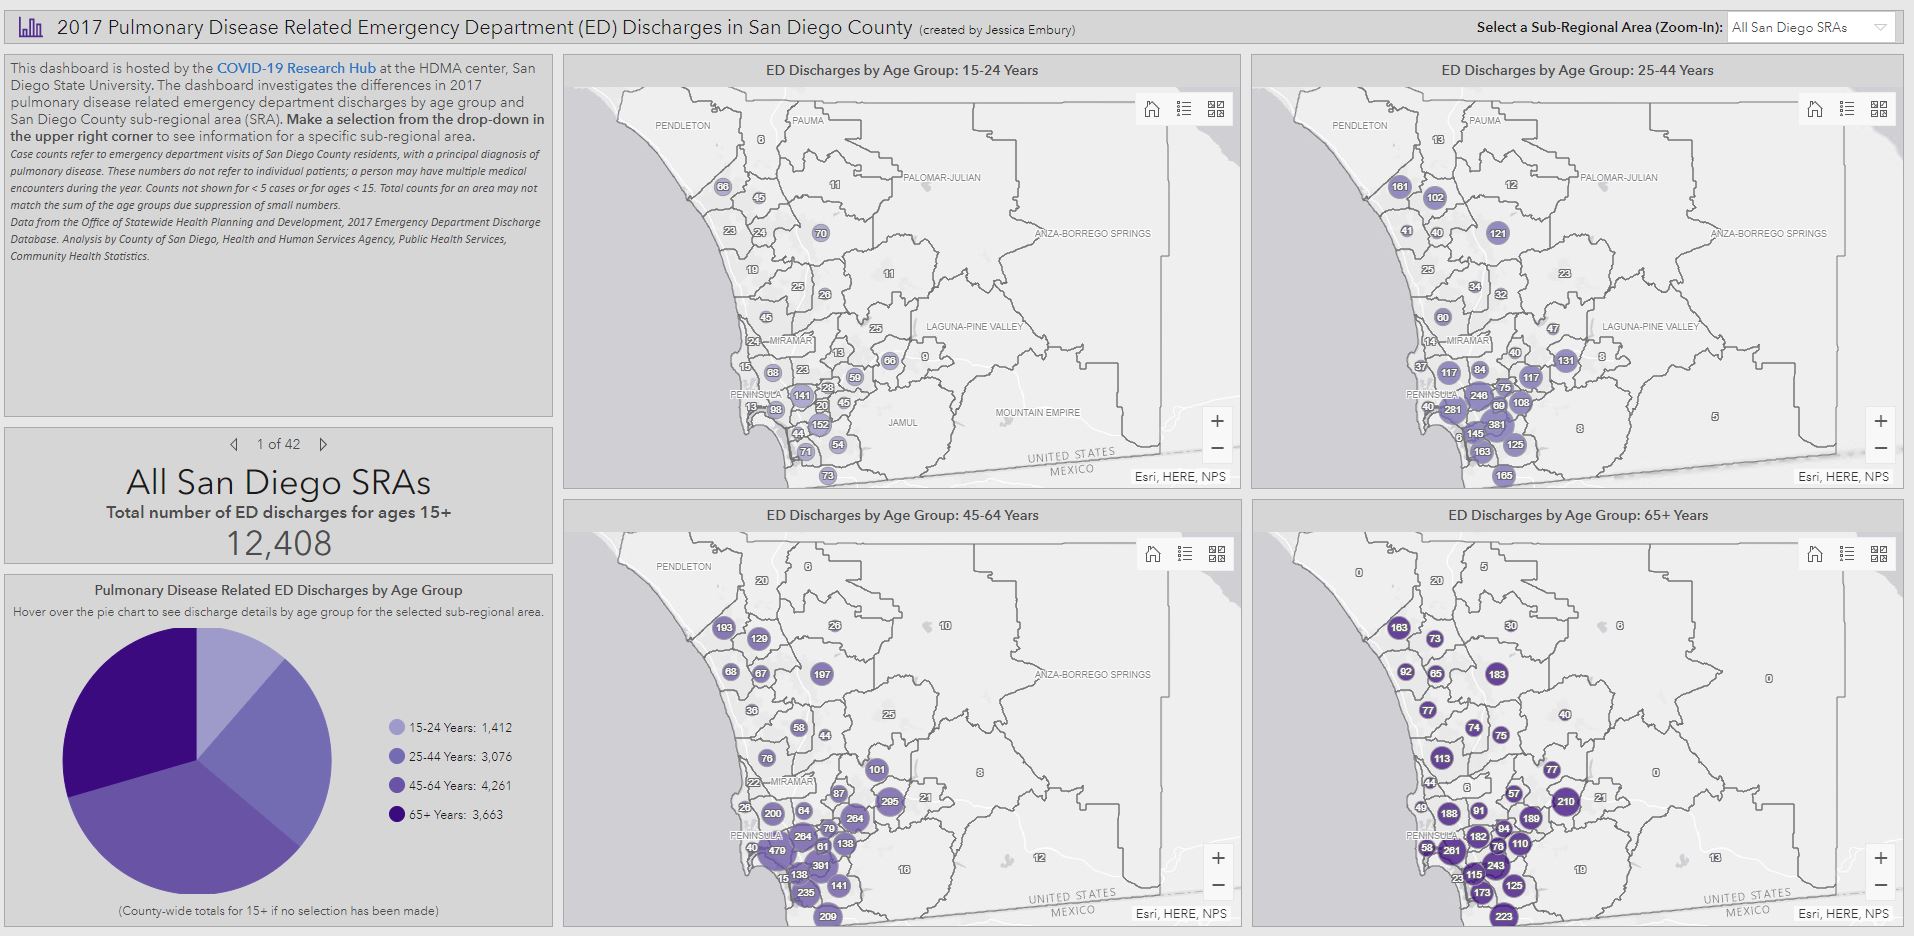
Pulmonary Disease Related Emergency Discharges in San Diego County
The HDMA center has created a dahsboard that looks at the difference in 2017 pulmonary disease related emergency department (ED) discharges by age group in San Diego county. This map was created by Jessica Embury at the HDMA Center.
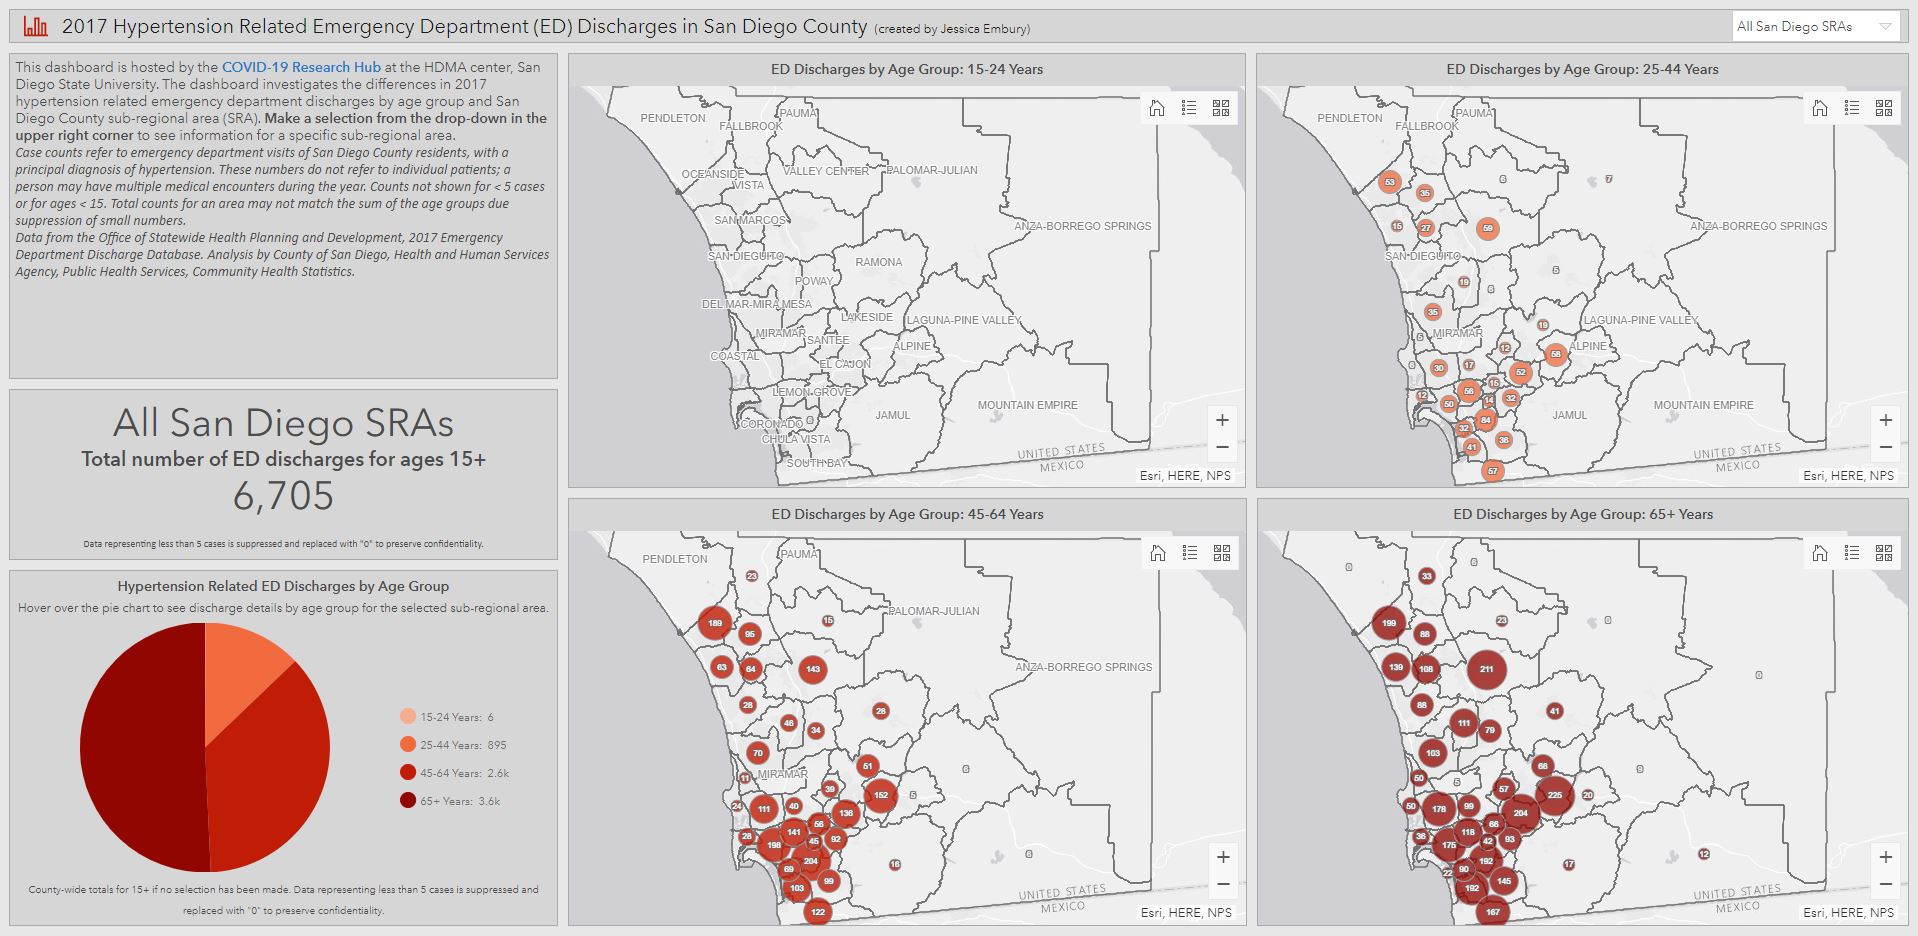
Hypertension Related Emergency Discharges in San Diego County
The HDMA center has created a dahsboard that examines the difference in 2017 hypertension related emergency department (ED) discharges by age group in San Diego county. This map was created by Jessica Embury at the HDMA Center.
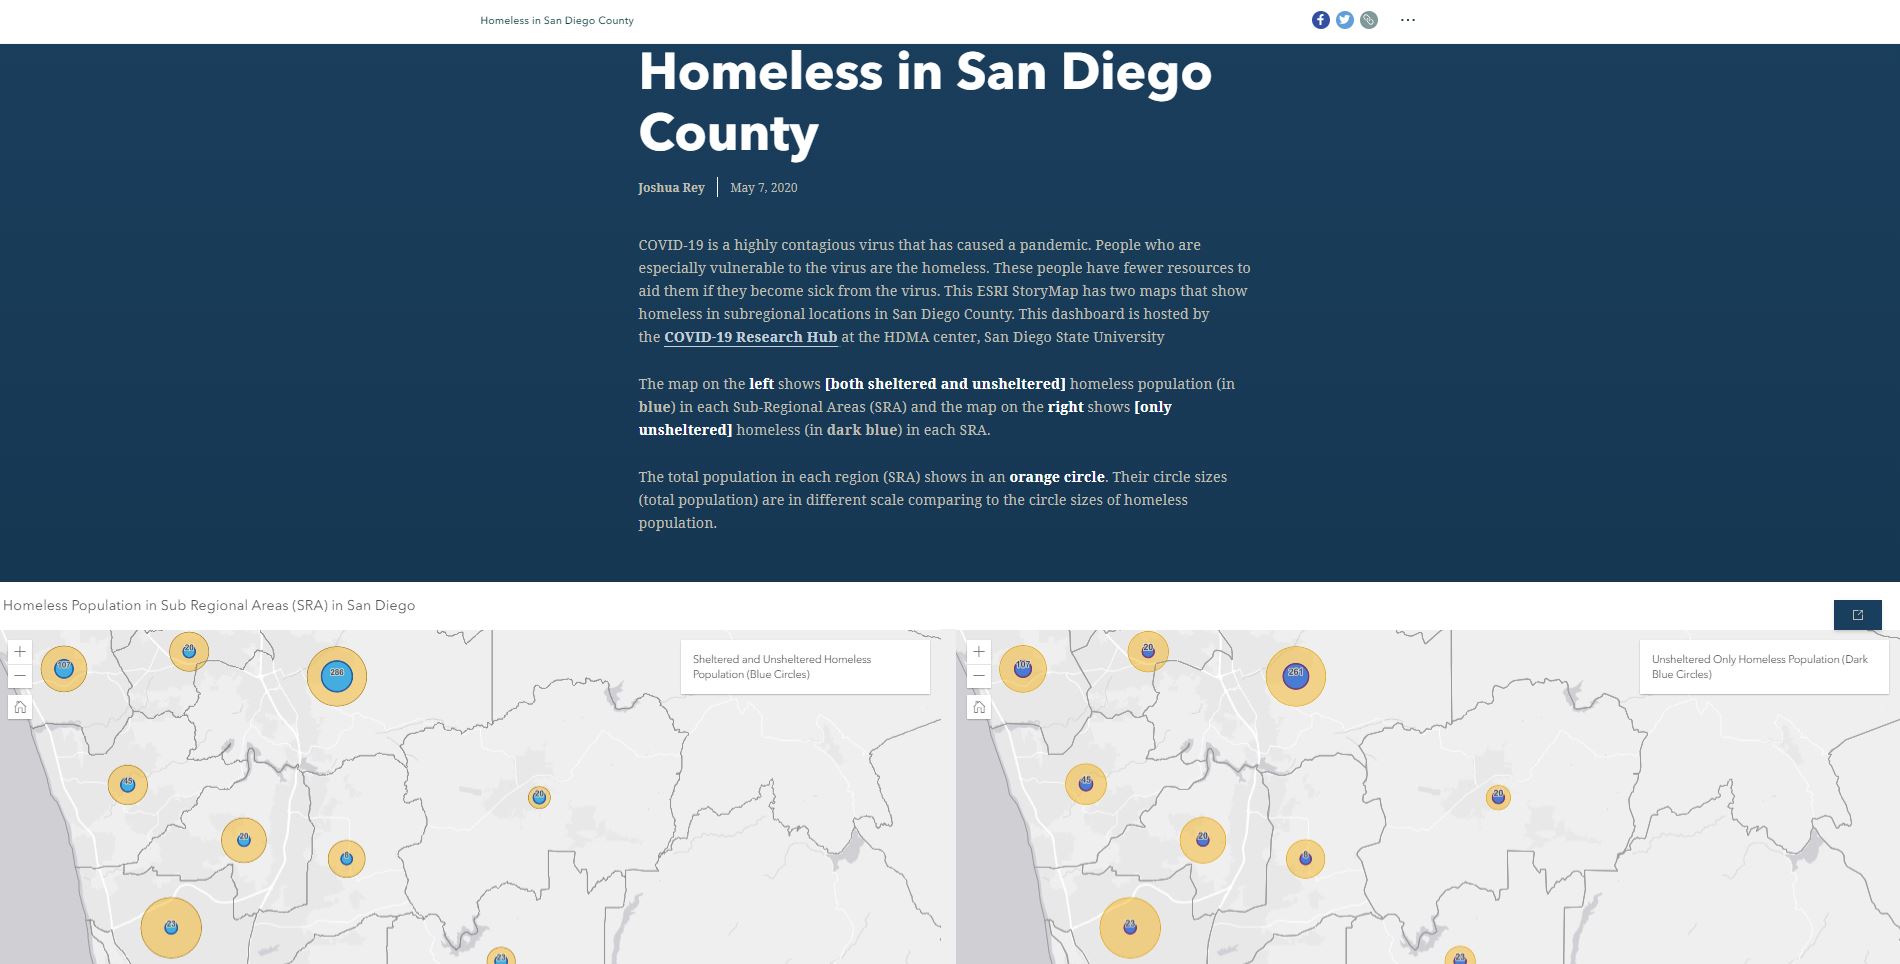
Homeless in San Diego County
The HDMA center has created a story map that looks at the concentration of where homeless populations are in San Diego County in response to COVID-19. This map was created by Joshua Rey at the HDMA Center.
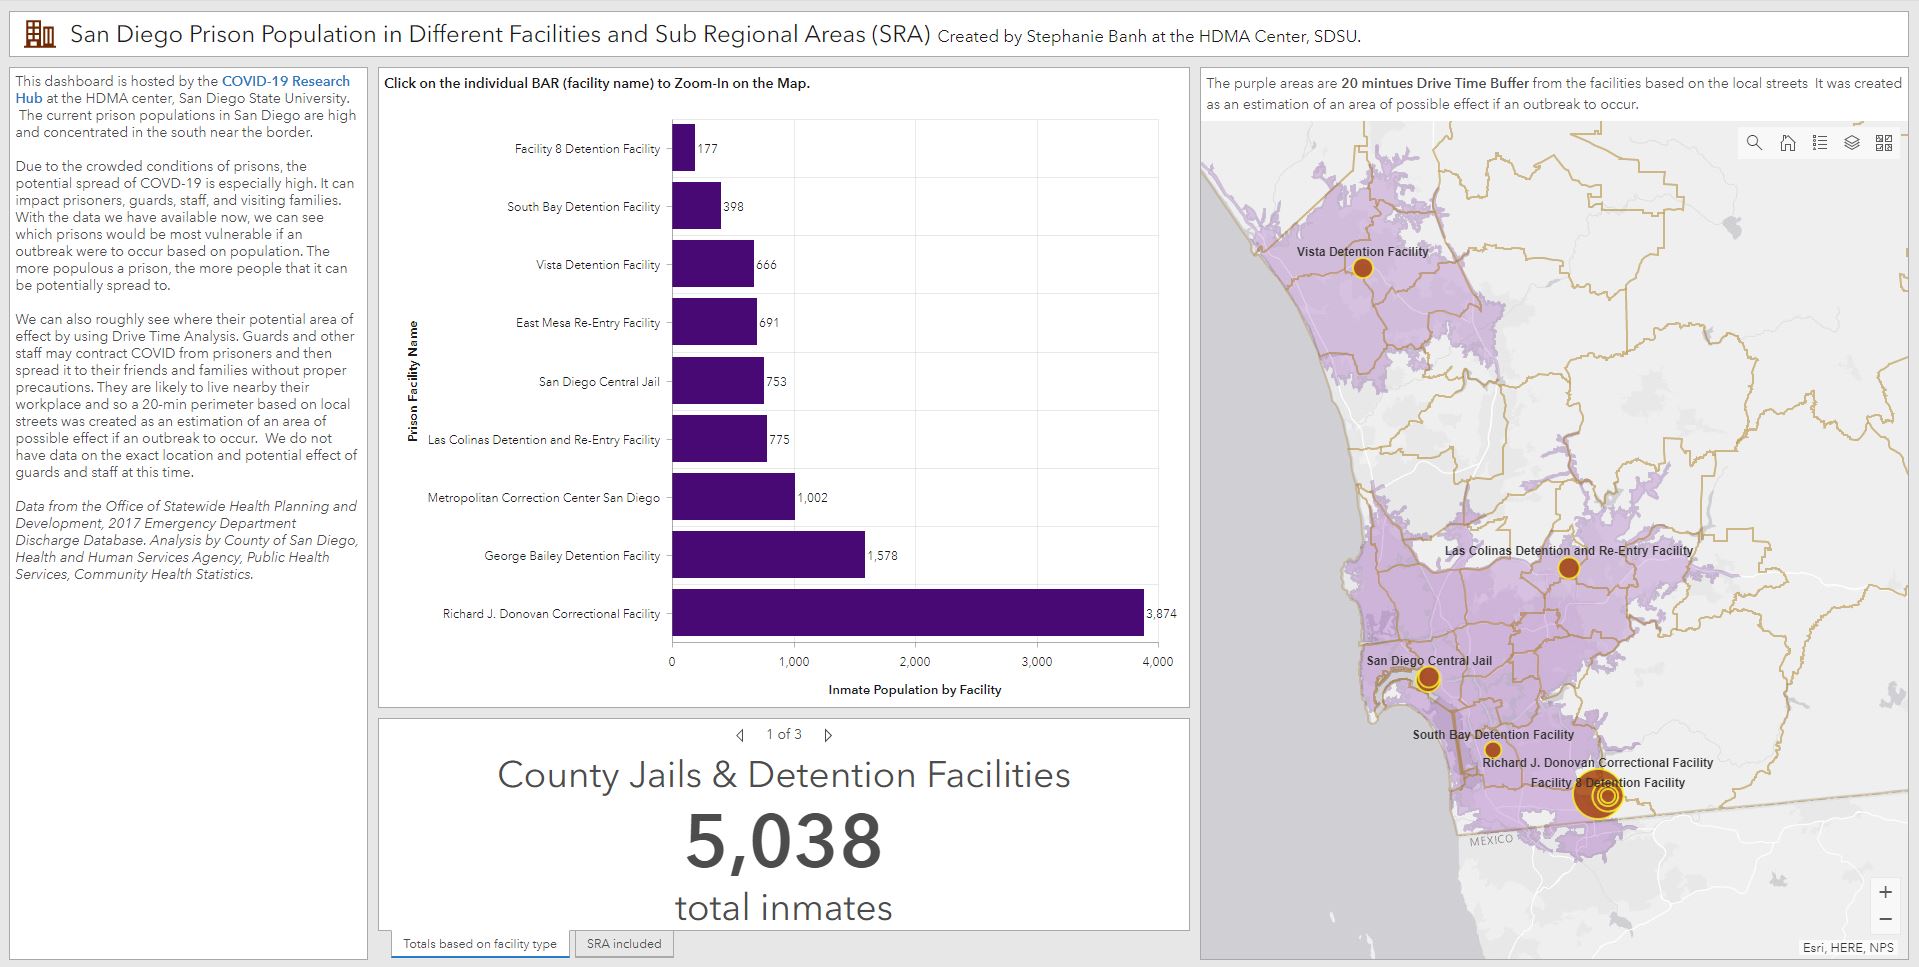
Prison Population in San Diego County
The HDMA center has created a dashboard that looks at the population of different detention and correctional facilities in San Diego County in response to COVID-19. This map was created by Stephanie Banh at the HDMA Center.
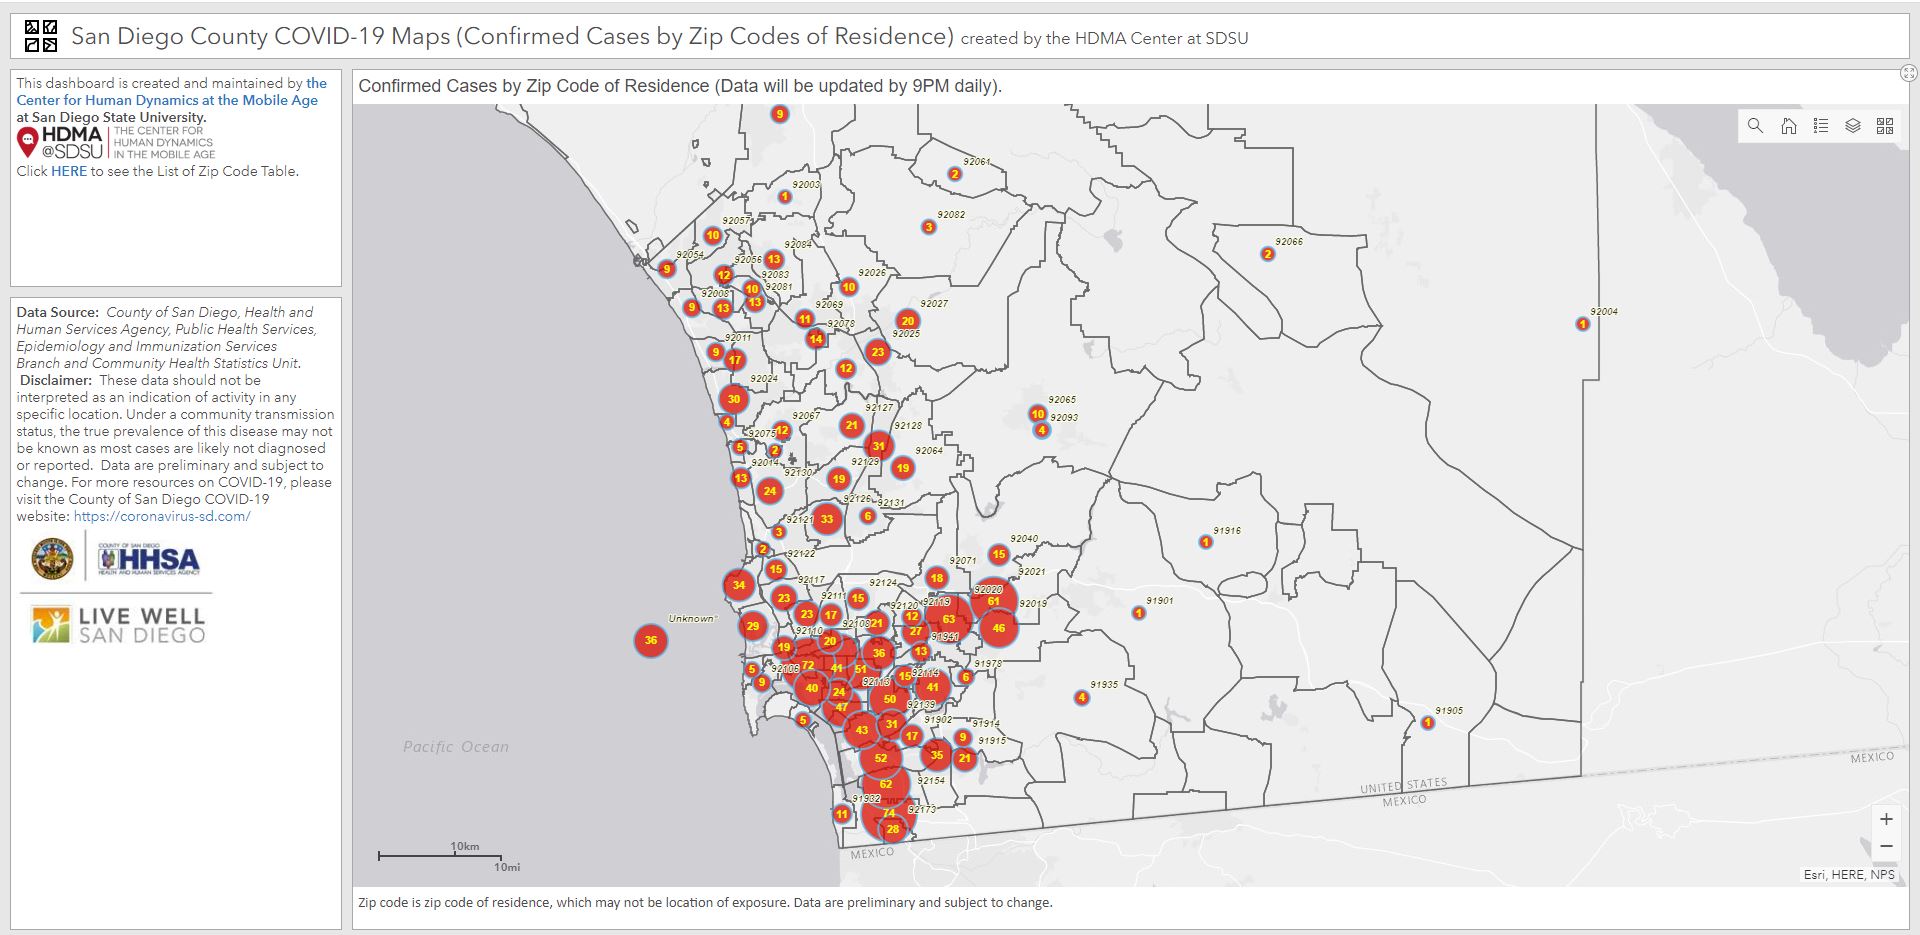
Confirmed Cases by Zip Code
The HDMA center has created a COVID-19 map showing the number of confirmed cases based on Zip Code in San Diego County. Two versions have been made- one for desktop (https://geography.sdsu.edu/covidmap) and the other for mobile (https://geography.sdsu.edu/covidmapmobile). The map is updated daily.
Mobile Site →
For Developers:
If you're interested in embedding this map on your website, feel free to use this code and set a link back to this site:
Embedded Web component CODE (iFrame):
<style>.embed-container {position: relative; padding-bottom: 80%; height: 0; max-width: 100%;} .embed-container iframe, .embed-container object, .embed-container iframe{position: absolute; top: 0; left: 0; width: 100%; height: 100%;} small{position: absolute; z-index: 40; bottom: 0; margin-bottom: -15px;}</style><div class="embed-container"><iframe width="500" height="400" frameborder="0" scrolling="no" marginheight="0" marginwidth="0" title="SD-COVID-Zipcodes_Main" src="//sdsugeo.maps.arcgis.com/apps/Embed/index.html?webmap=763a114f5f114139af5517ac4c785bd8&extent=-117.2488,32.577,-116.8762,32.7772&zoom=true&previewImage=false&scale=true&disable_scroll=true&theme=light"></iframe></div>