Analytics Dashboard The HDMA center's Analytics Dashbords for the coronavirus, including Daily New Cases, 7 Day Rolling Rate, and others.
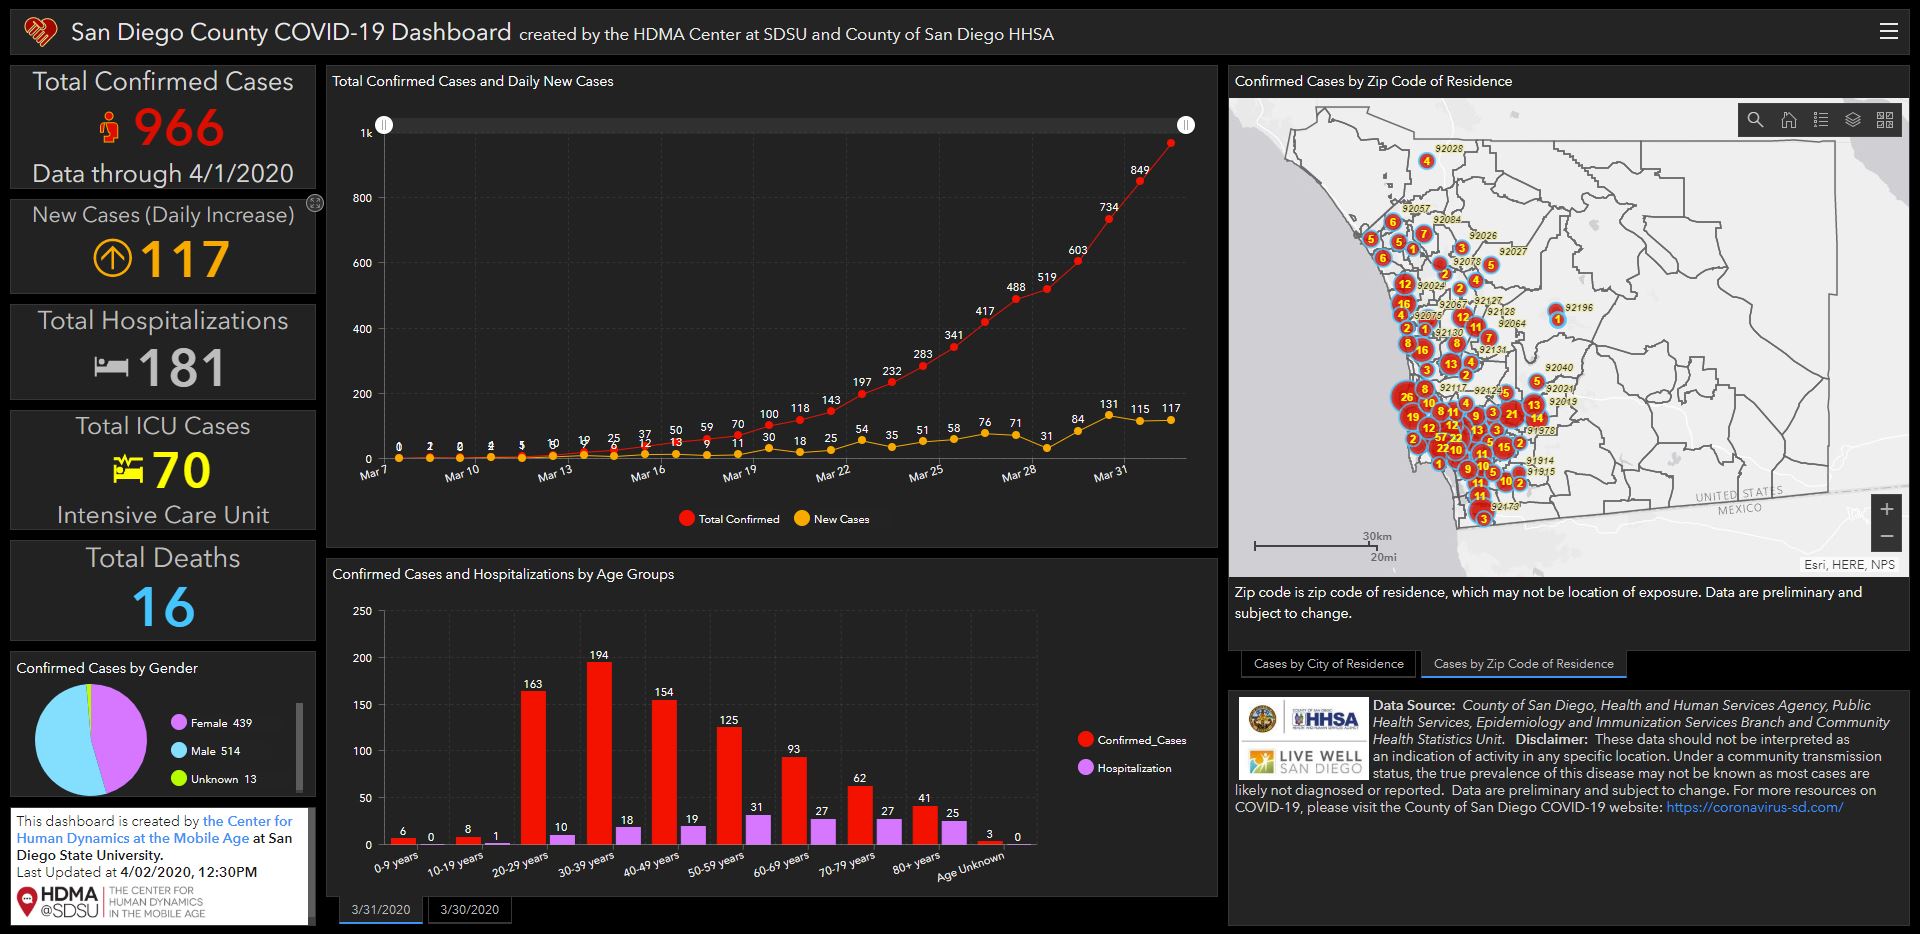
San Diego County COVID-19 Dashboard
The analytics dashboard displays interactive tiles featuring information and maps for the coronavirus in San Diego County.
The dashboard is no longer being updated since the County of San Diego has created their official dashboard.
The dashboard can be viewed here:
HDMA Dashboard →Project Details
- Zip code map
- A variety of charts graphing total cases, deaths, age groups, etc over time.
- Cases vs hospitalizations
- Statistical data on cases, hospitalizations, deaths, etc.
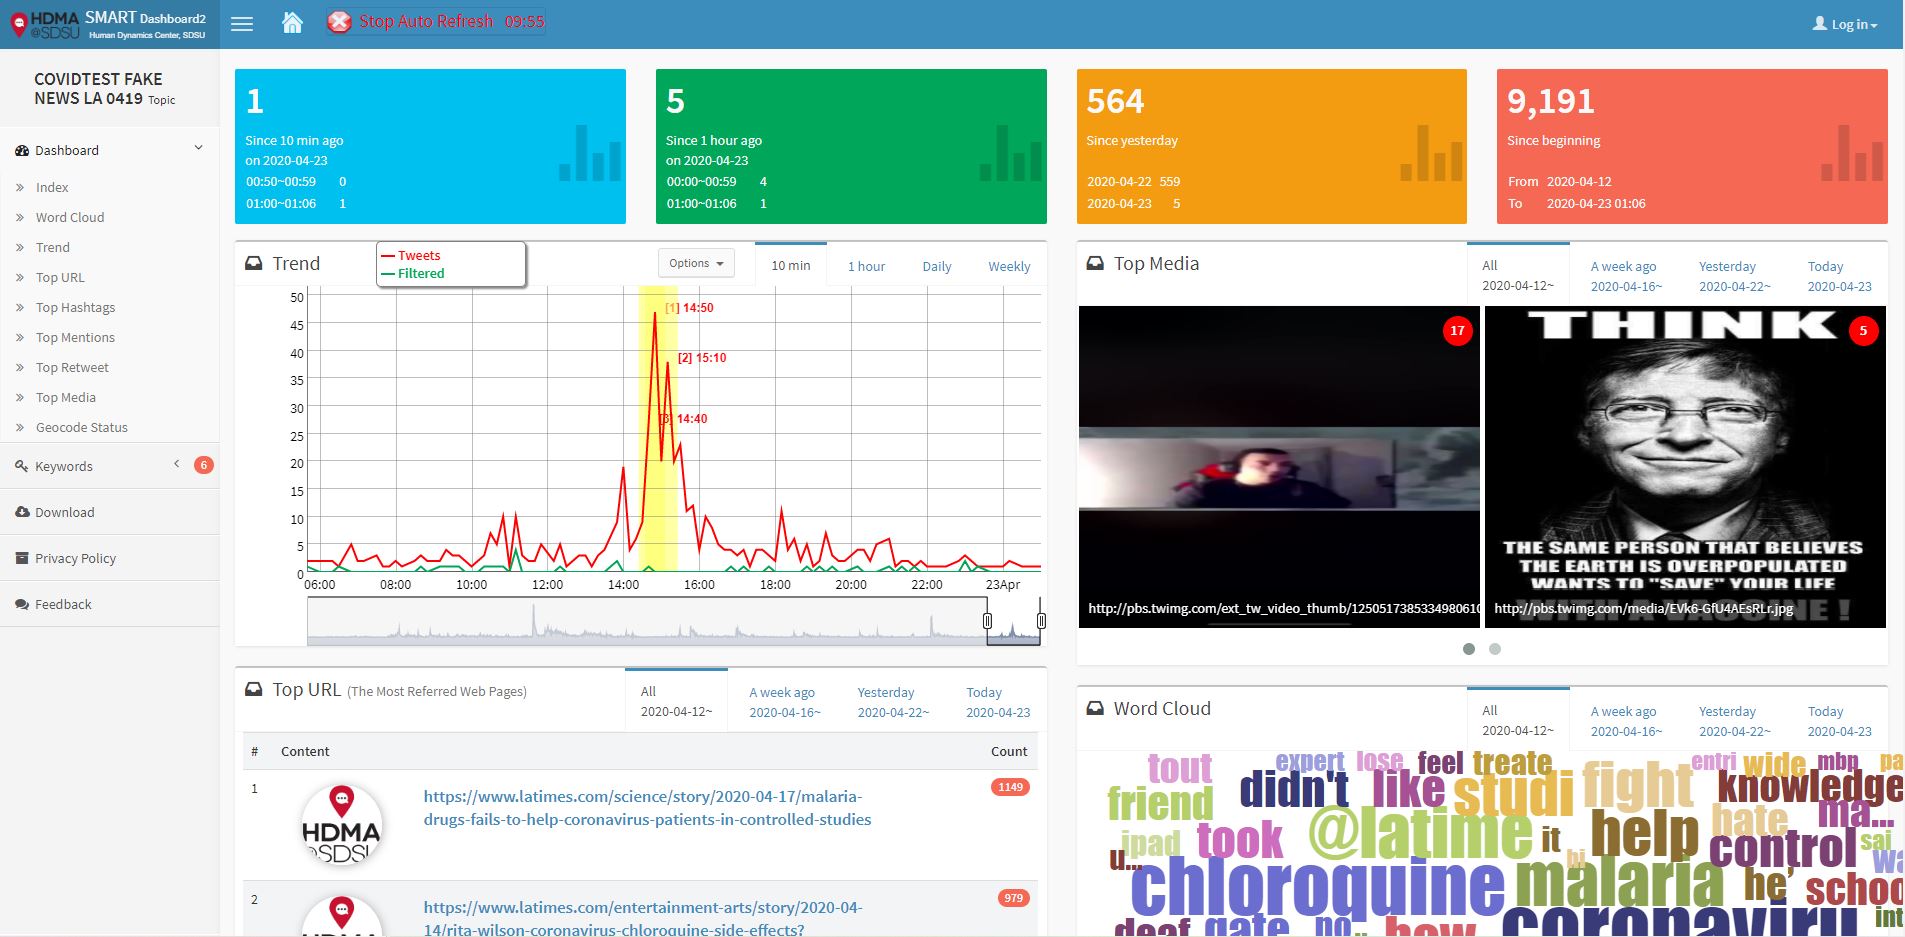

Social Media Analytic and Research Testbed (SMART)
SMART Dashboard is a keyword-based search tool for Twitter messages to monitor the diffusion of information and social behavior changes in real time. It provides an automatic procedure to help researchers to:
- 1. Analyze social media data from a spatiotemporal perspective- in real time, every 10 minutes, hourly, and daily
- 2. Filter noises like removing redundant retweets and using machine learning methods to improve precision
- 3. Integrate geo-coded, geo-tagged, and non-geocoded tweets
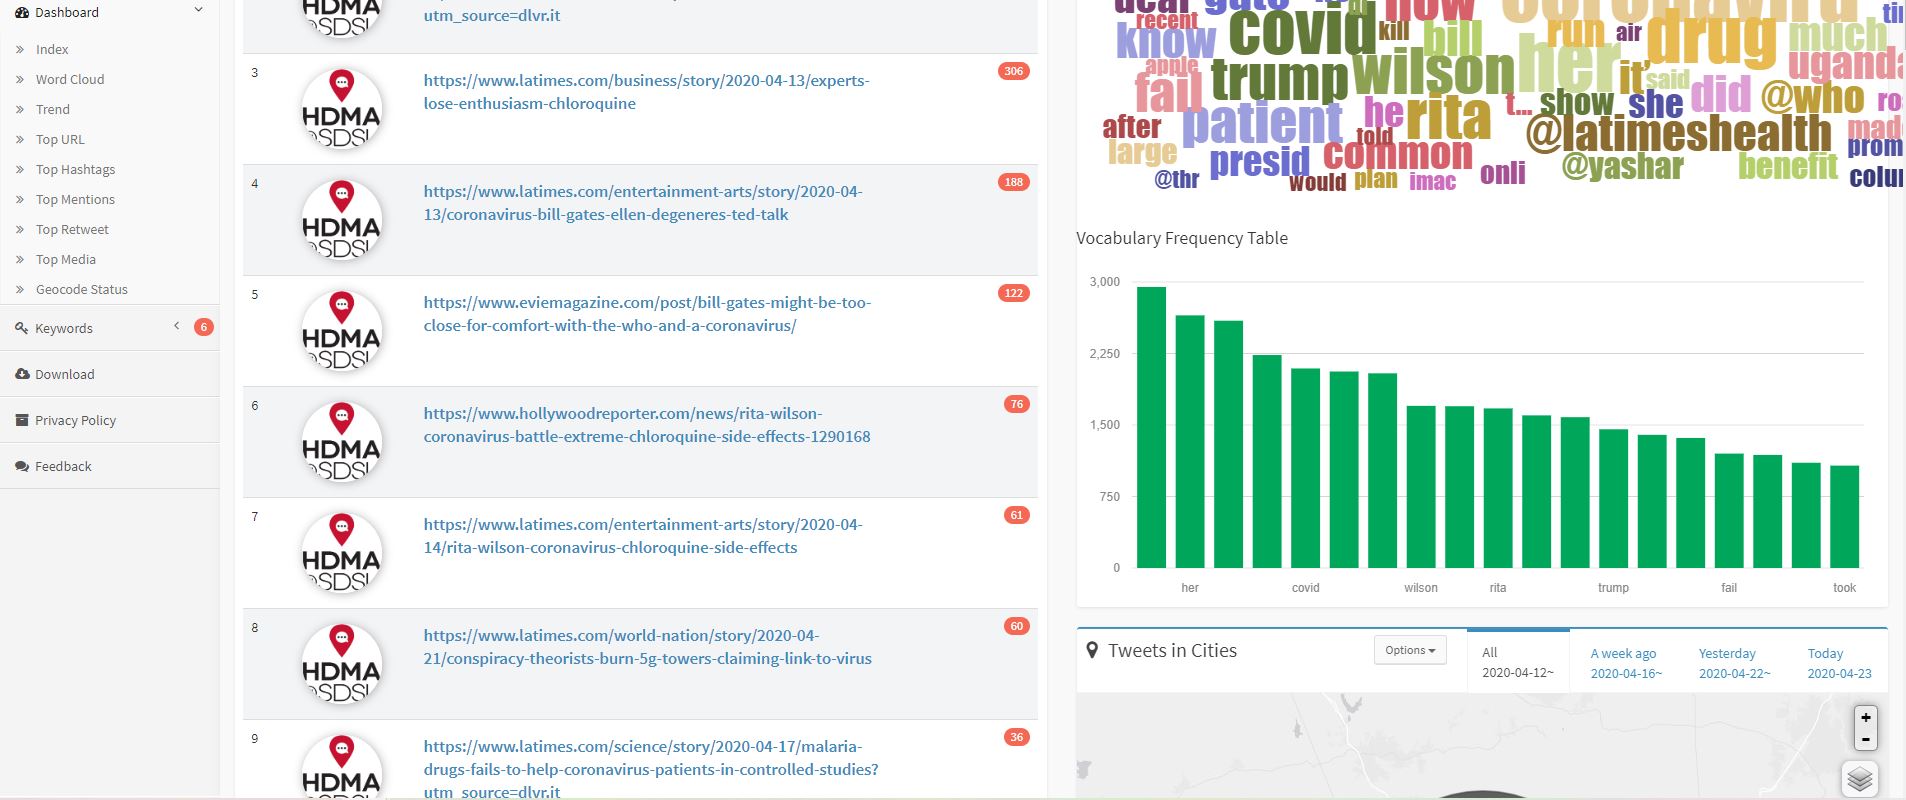
- 4. Visualize social media in a variety of aspects (such as top URLs, top retweets, top mentions, or top hashtags)
- Monitoring Fake News and Rumors in L.A. (real time) LA Fake News
- Monitoring Protesting Events in L.A. (real-time) LA Protests
- Monitoring COVID-19 keywords in L.A. (from 3/17 to 4/10) LA COVID-19 Keywords
- Monitoring COVID-19 keywords in San Diego (from 3/17 to 4/10) SD COVID-19 Keywords
- Monitoring COVID-19 keywords in New York (from 3/17 to 4/10) NY COVID-19 Keywords