Other Maps and Information Additional resources for maps and data about the coronavirus
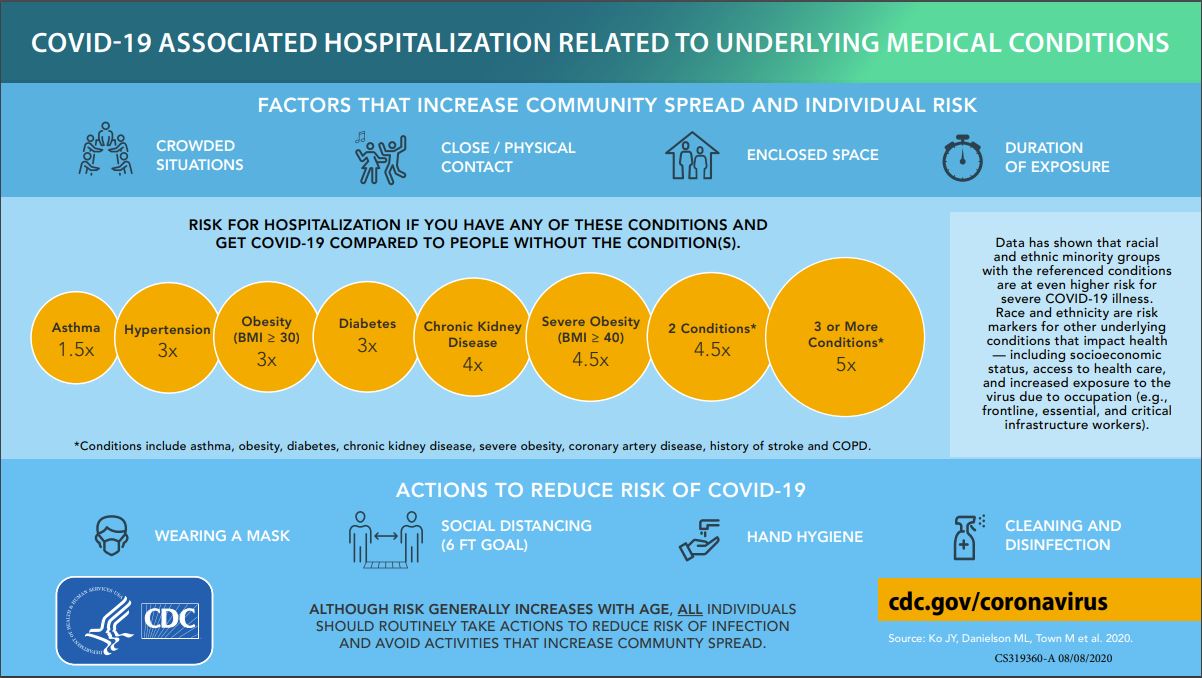
CDC COVID-19 Underlying Medical Conditions
The CDC has posted the underlying medical conditions and rate of incresed risk they pose for contracting COVID-19.
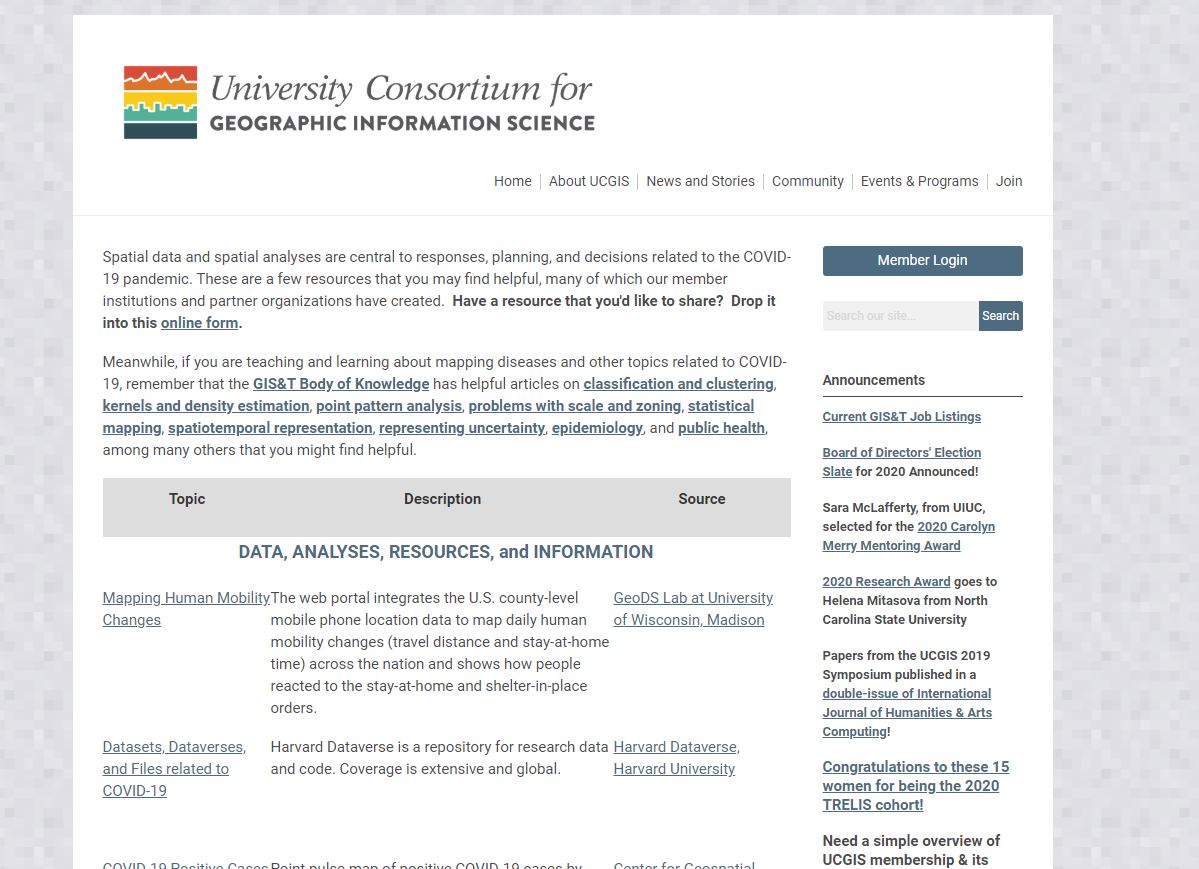
COVID-19 Resource List
COVID-19 Resource List compiled by the University Consortium for Geographic Information Science (UCGIS).
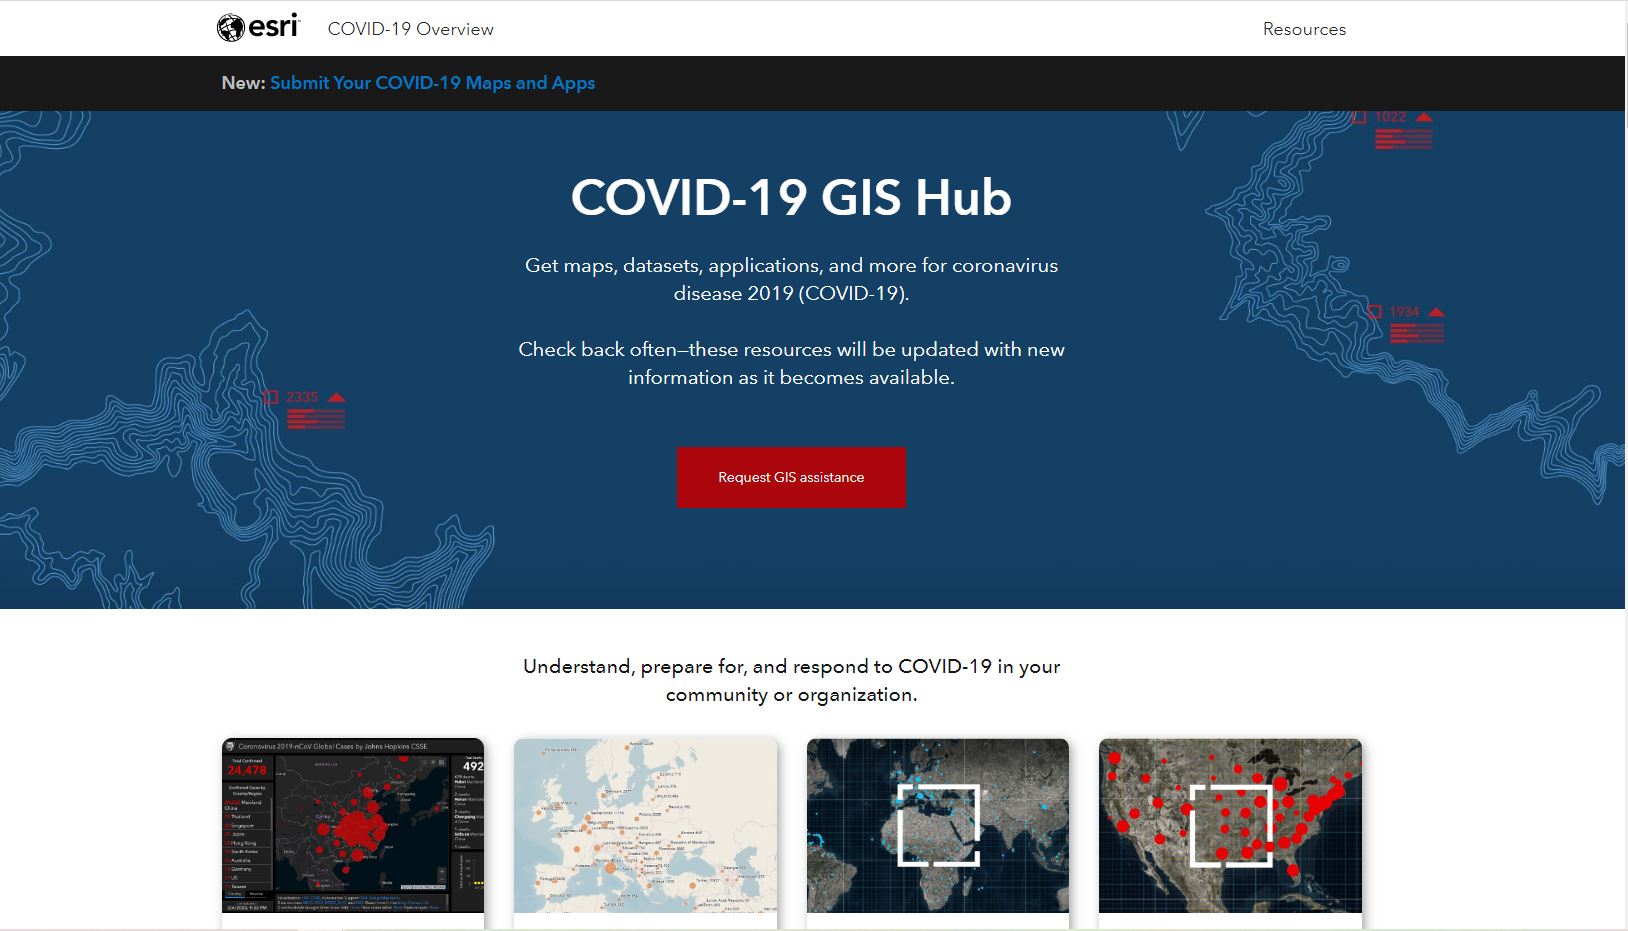
ESRI COVID_19 GIS HUB
Maps, datasets, applications, and more for coronavirus projects
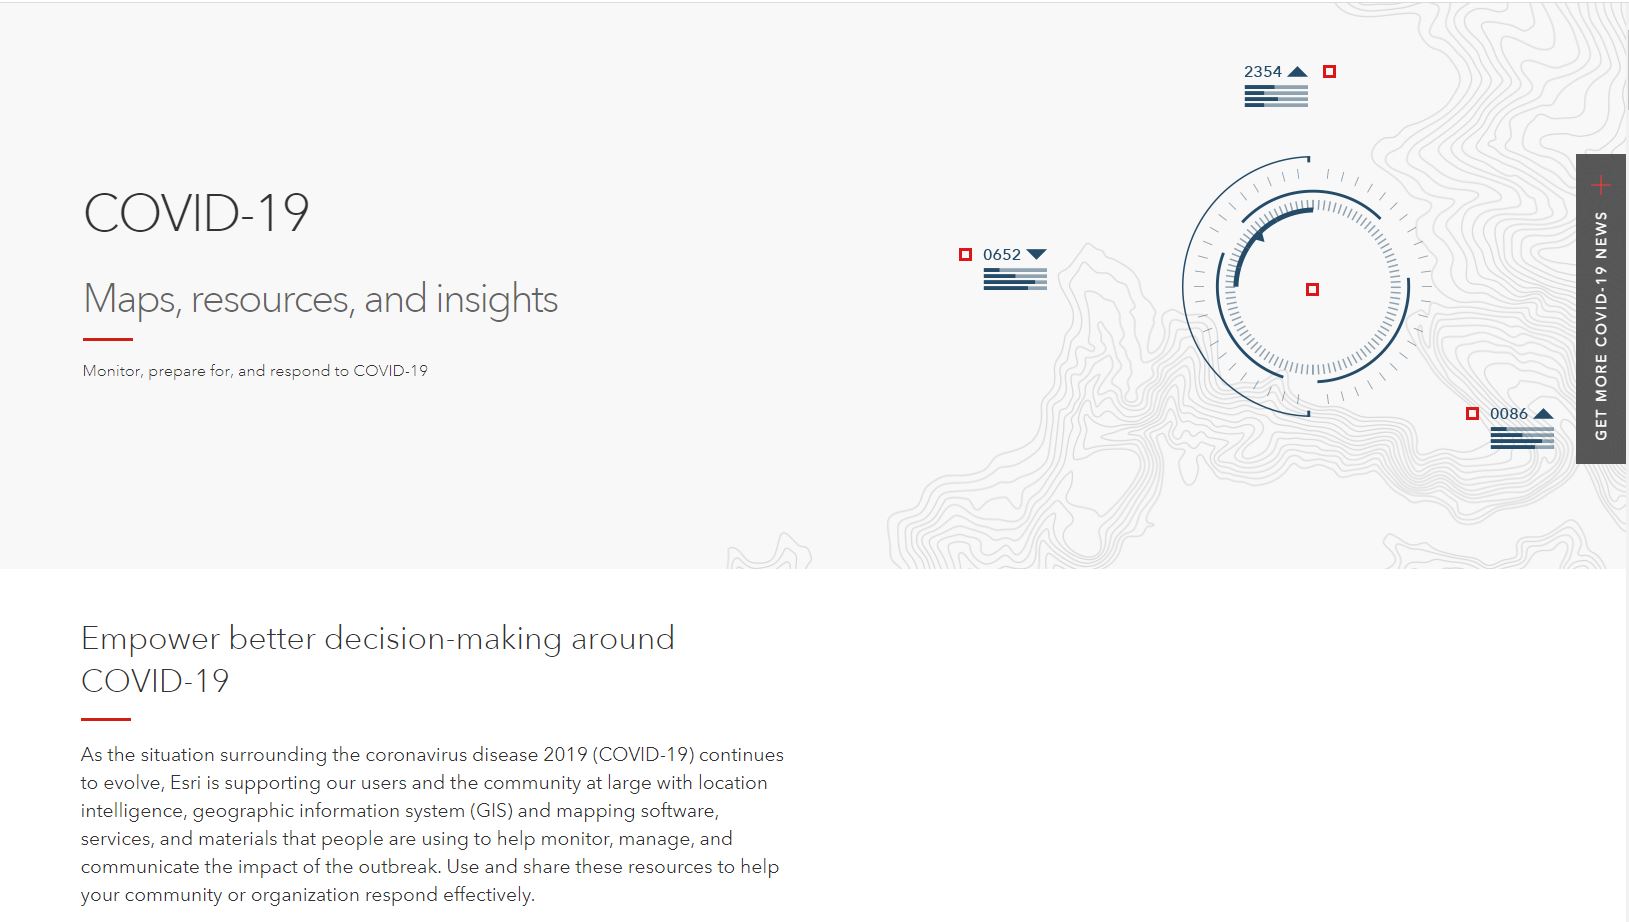
ESRI COVID_19 Maps, Resources, and Insights
A collection of tools and resources supported by ESRI to help users monitor, prepare for, and respond to COVID-19.
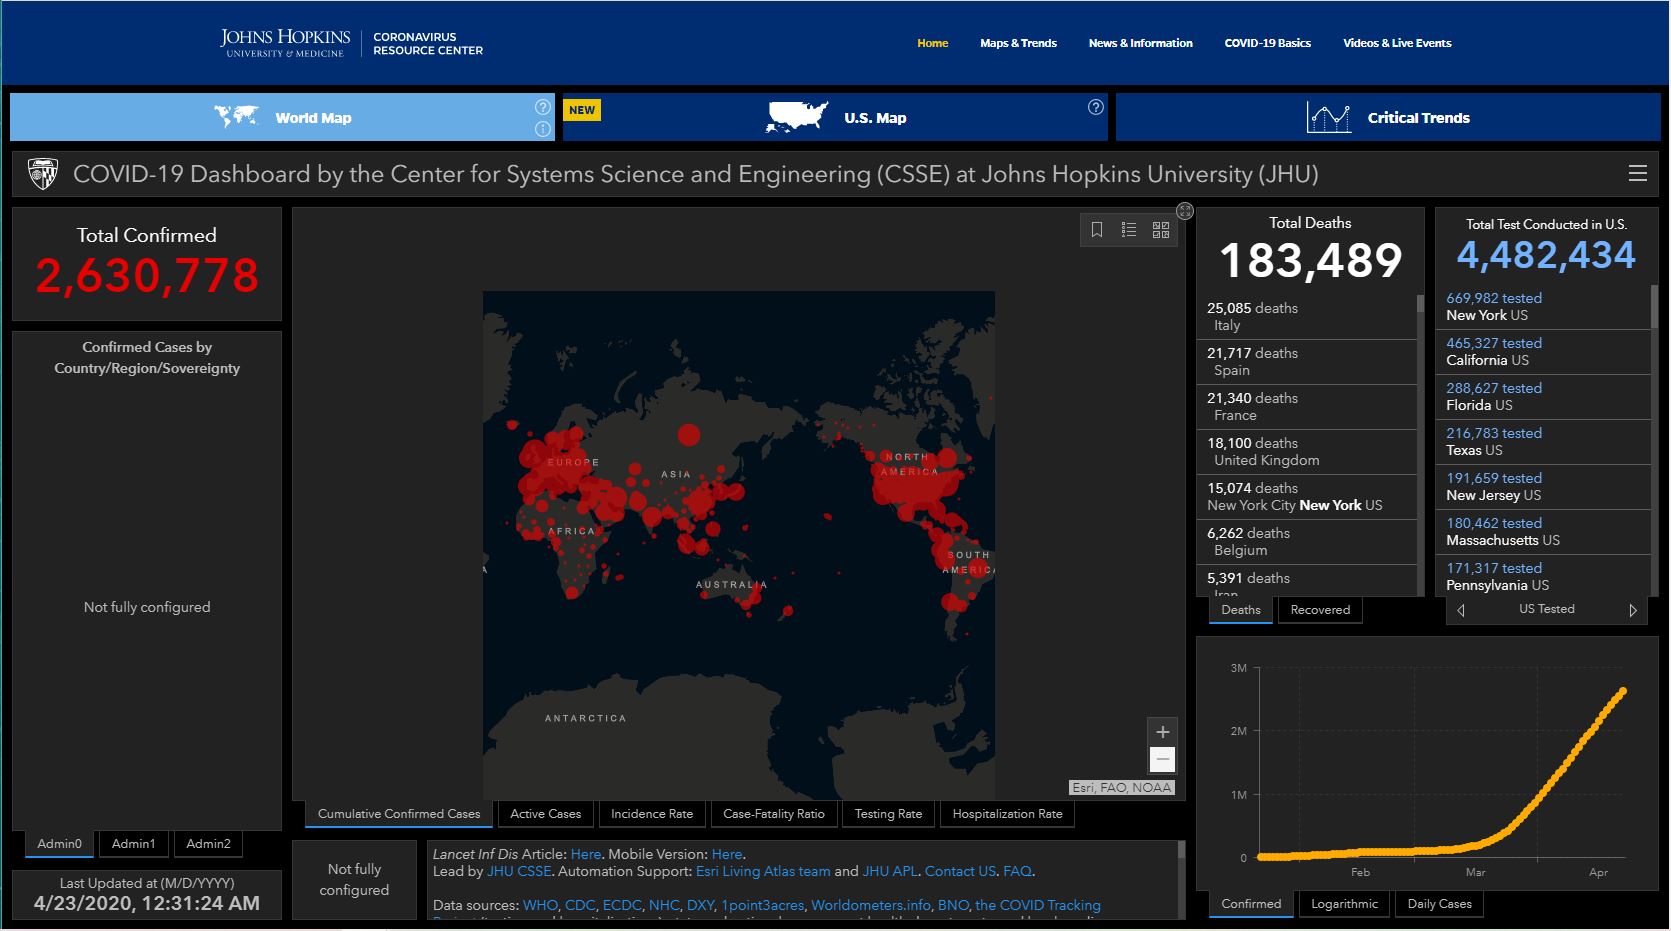
Johns Hopkins University Analytics Dashboard
The Johns Hopkins University Analytics Dashboard for world wide coronavirus information.
HGIS Lab Novel Coronavirus (COVID-19) Infection Map
The Humanistic GIS Lab at University of Washington interactive infection rate map.
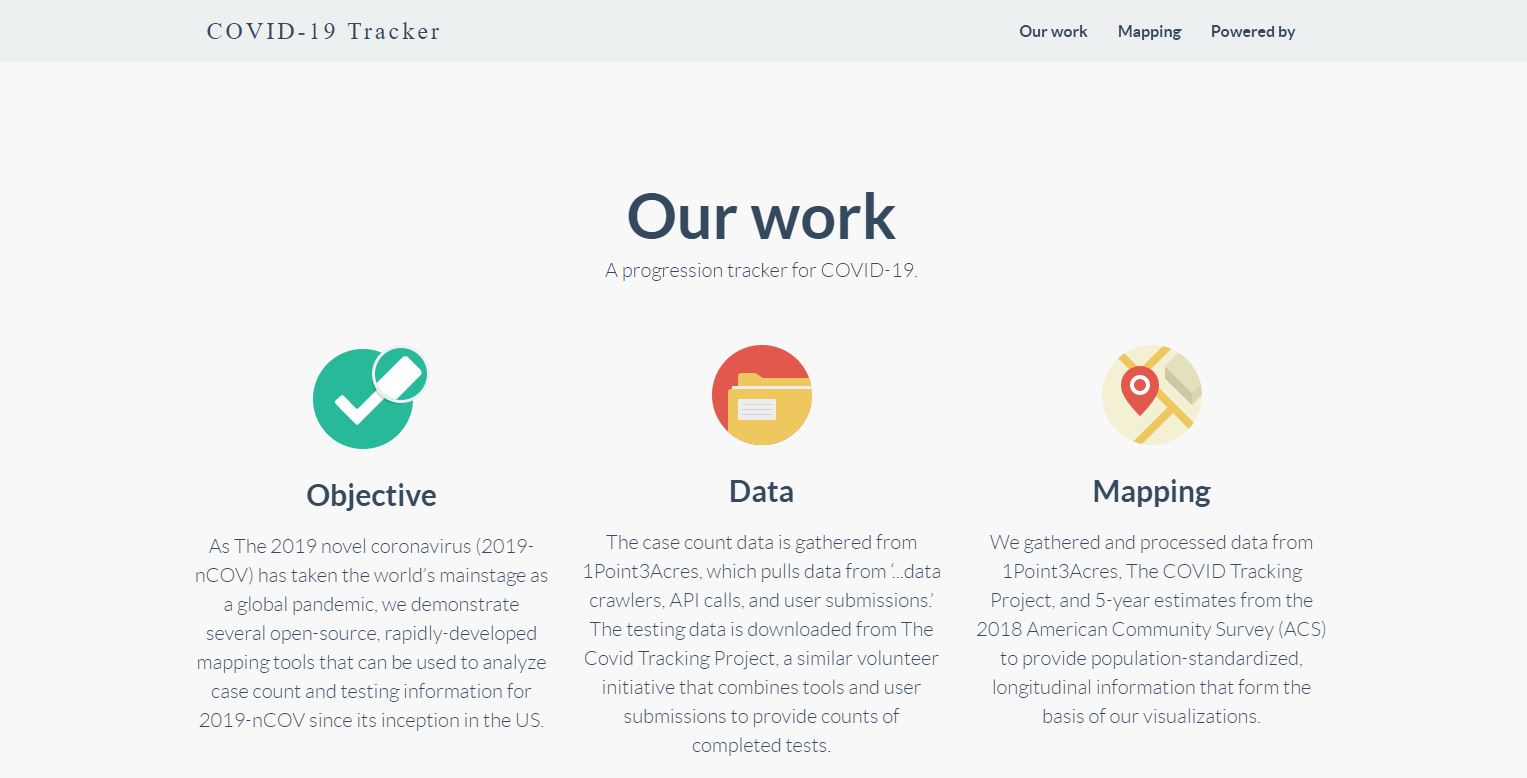
CGIS COVID-19 Tracker
The Center for Geospatial Information Science at University of Maryland progression visualizations.
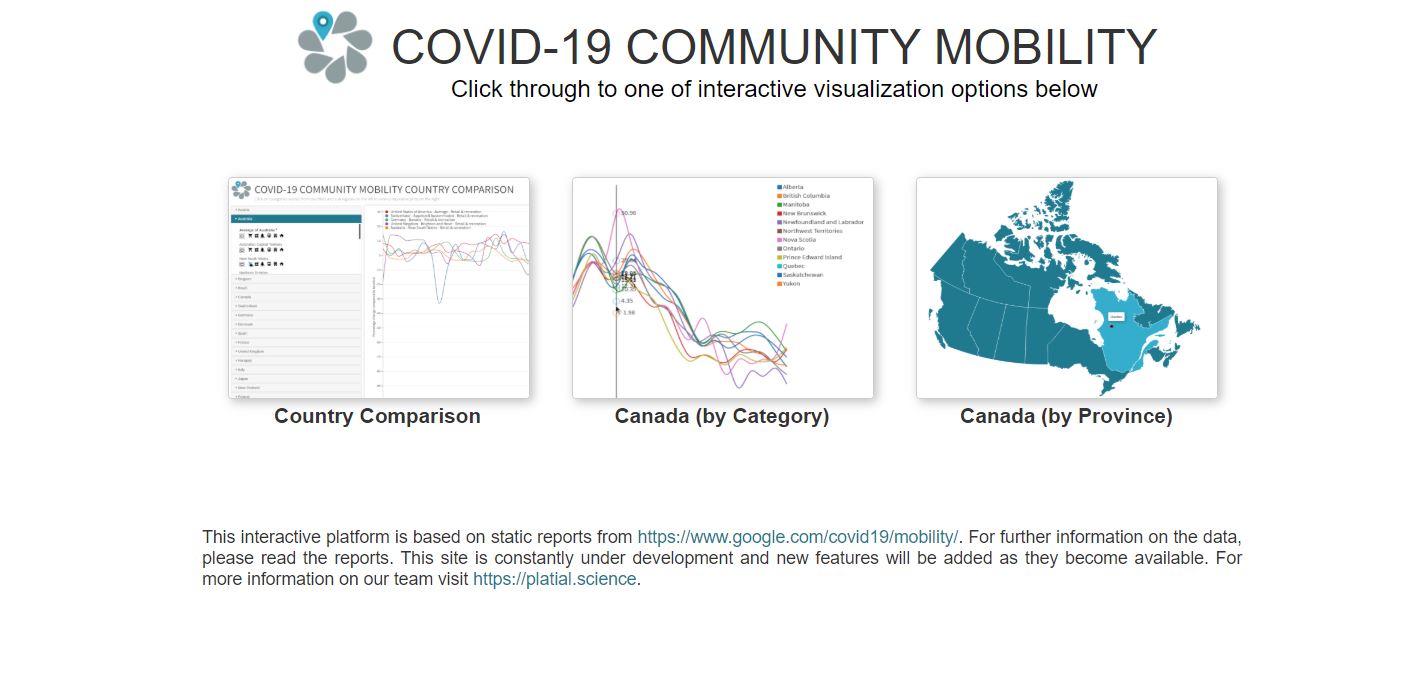
Canada Covid-19 Community Mobility
An interactive platform based on static reports for COVID-19, created by the Palatial Analysis Lab based in Canada.
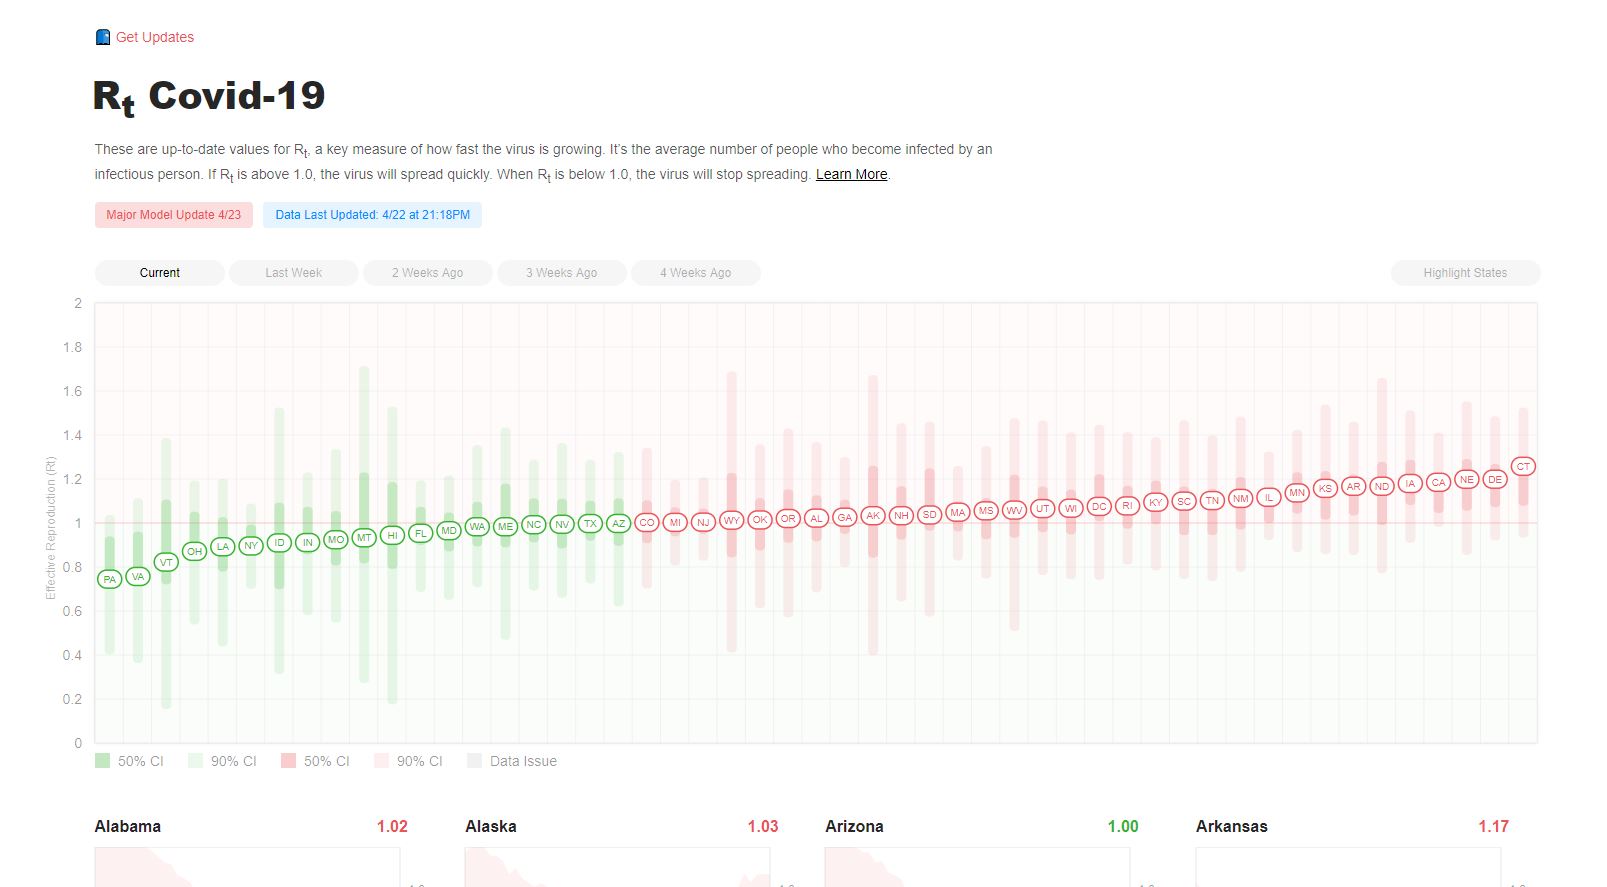
Rt Value Monitoring for COVID-19
Up-to-date Rt COVID-19 values- a key measure of how fast the virus is growing.
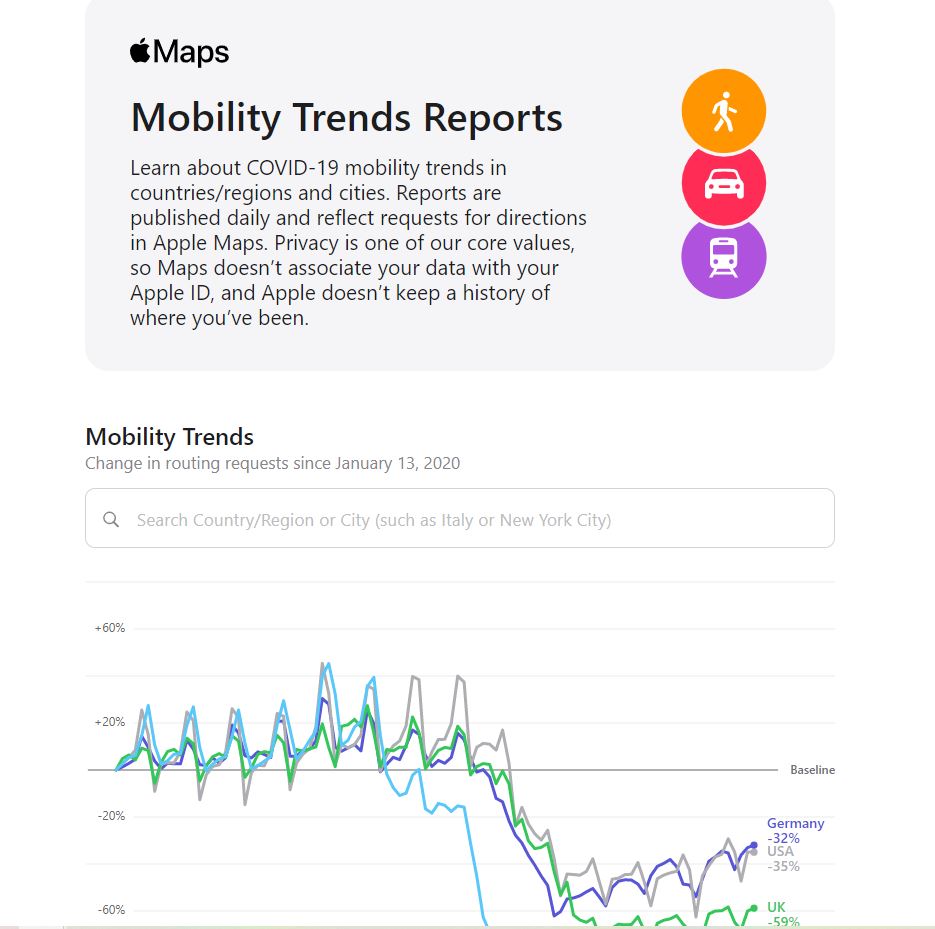
Apple Mobility Trends Reports
Daily mobility trend reports and data created by Apple.
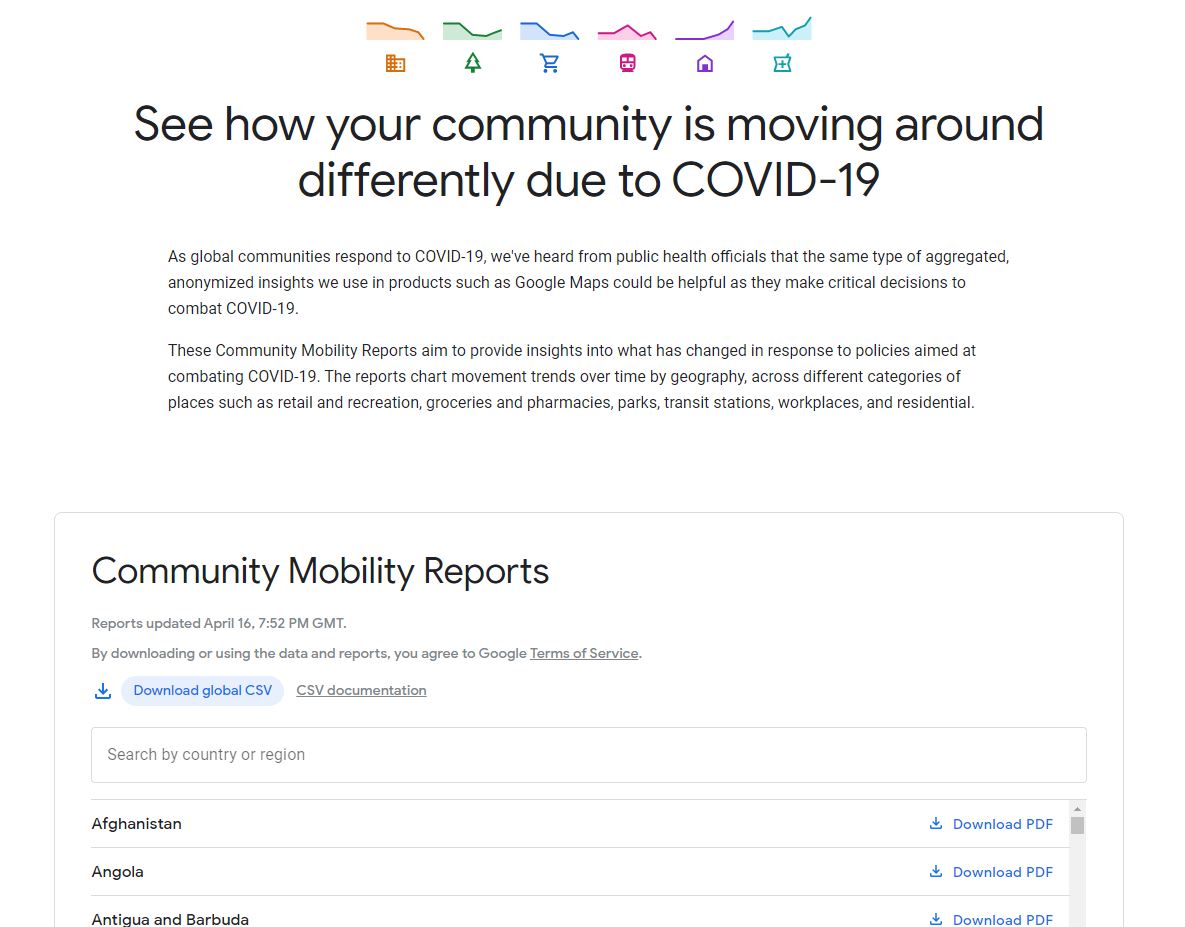
Google Mobility Trends Reports
Community mobility trend reports created by Google.
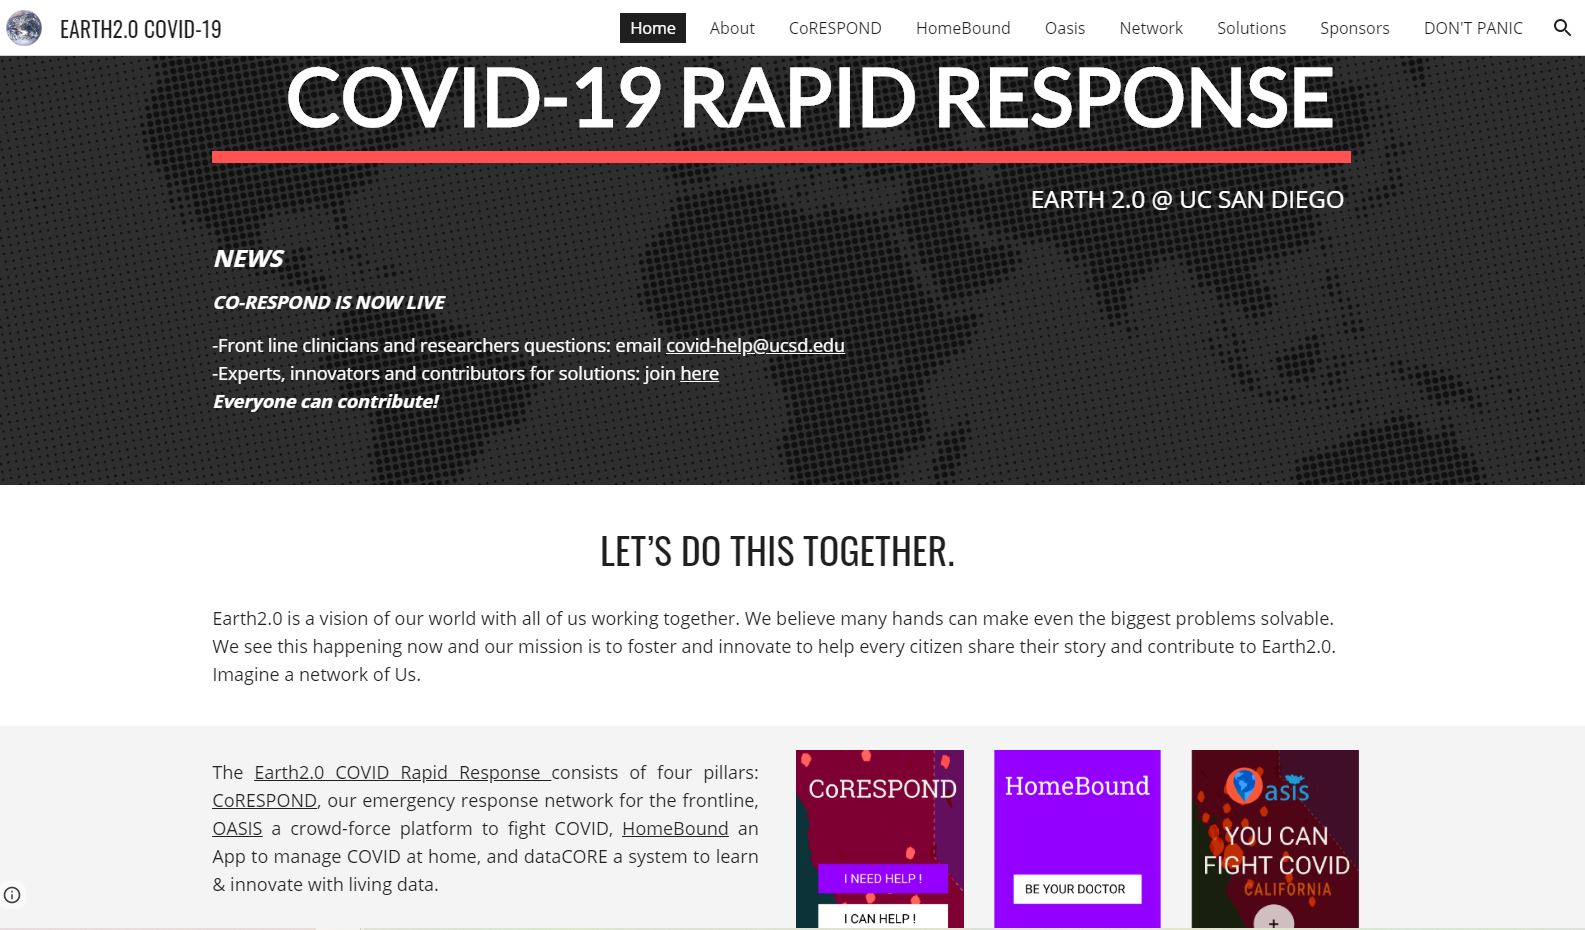
Earth2.0 COVID-19 Rapid Response
A four-part response system created by University of California, San Diego.
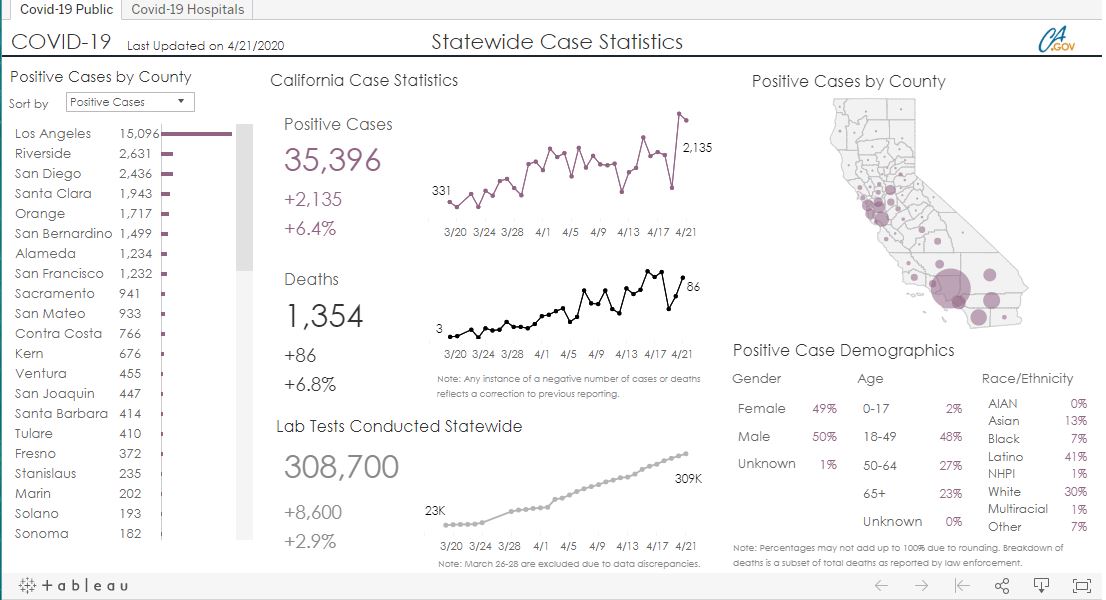
California Health and HumanServices Open Data Portal
A dashboard dedicated to California statewide case statistics and hospital data.
University of Minnesota Visuals
COVID-19 maps and visualization resources from the University of Minnesota.