COVID-19 Tracing Cases Maps related to tracing COVID-19 cases.
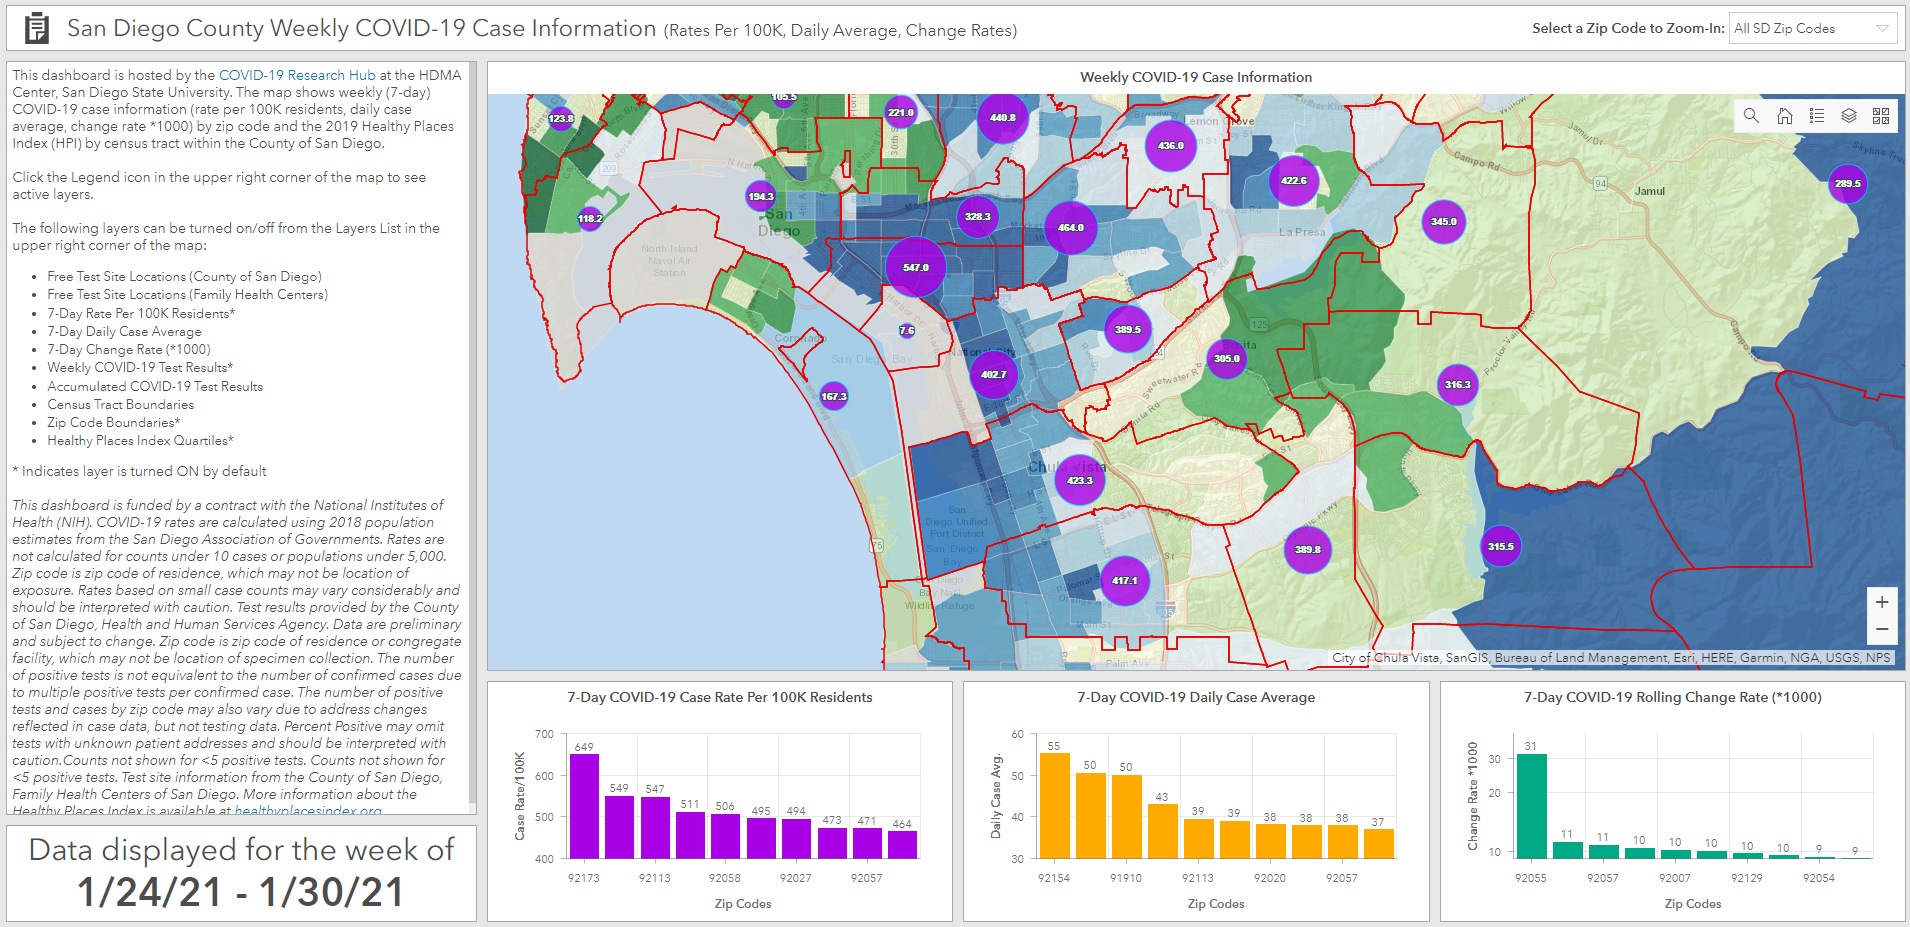
San Diego County Weekly COVID-19 Case Information
In collaboration with the NIH RADx-Up Communities Fighting COVID Project, the HDMA Center created a dashboard that examines COVID-19 in San Diego County zip codes based on 7-day case rates per 100,000 residents, 7-day daily case averages, and 7-day rates of change (*1,000). The dashboard is updated weekly and displays data from the previous week (Wednesday - Tuesday).
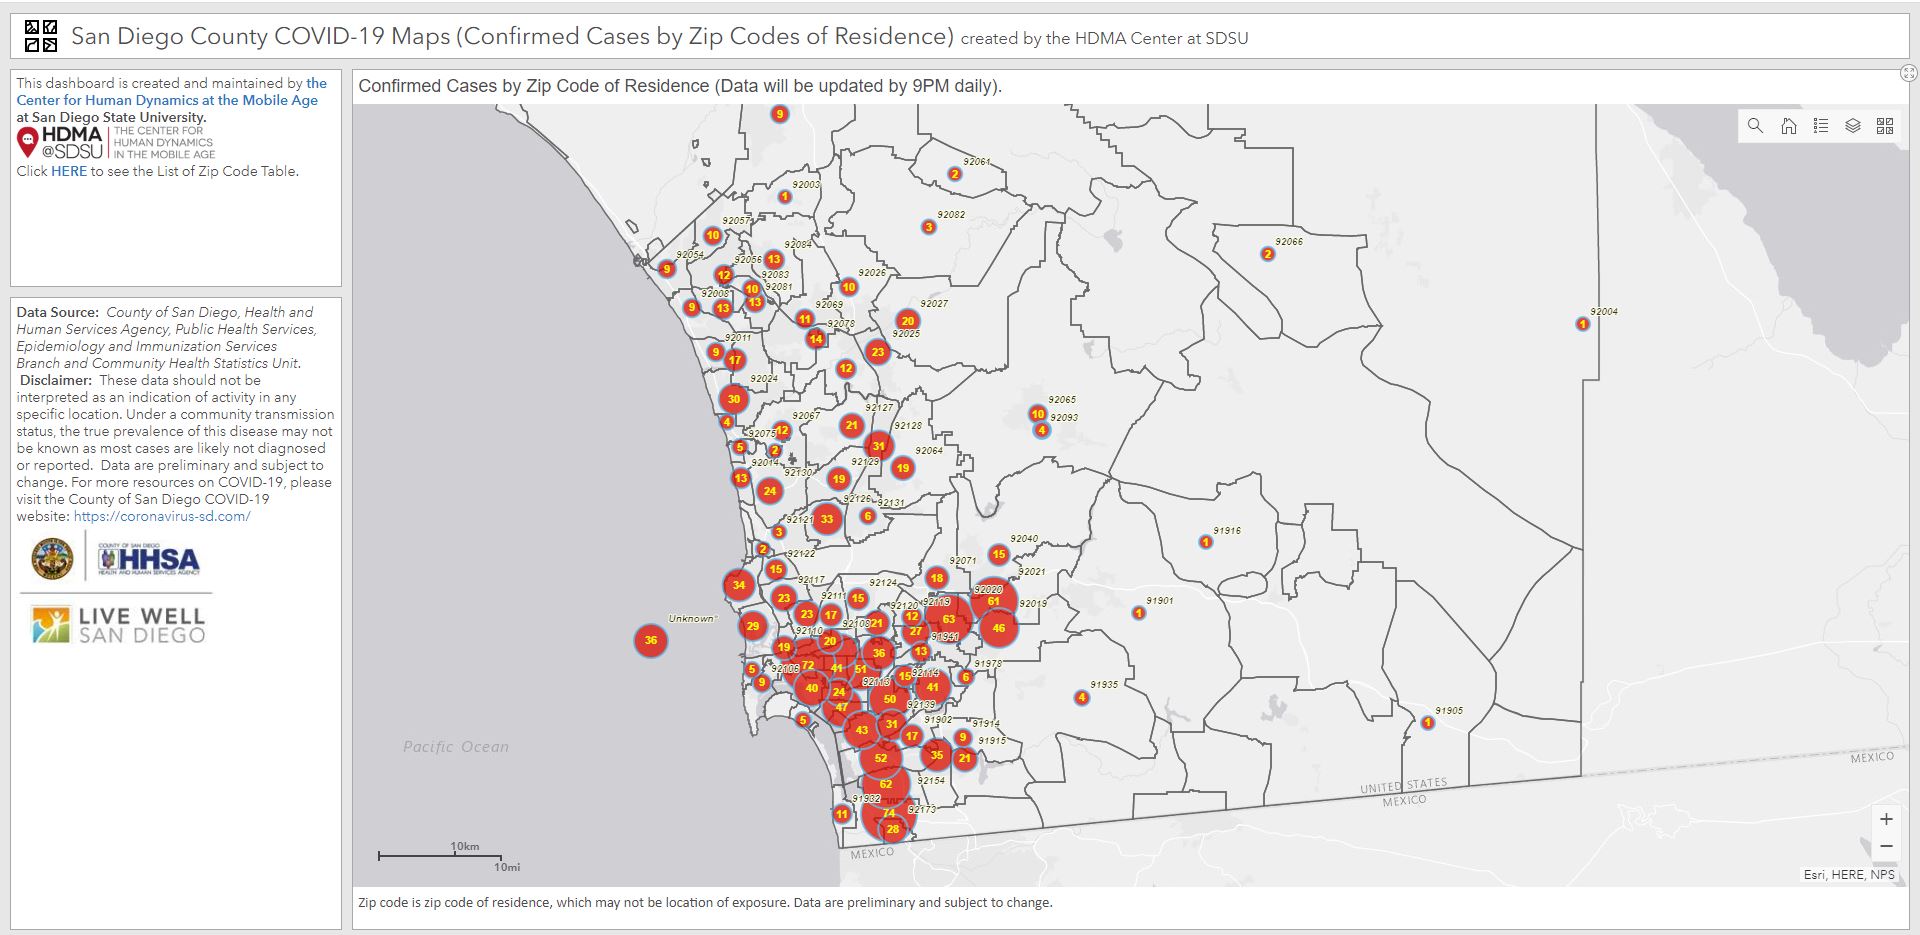
Cumulative Confirmed Cases by Zip Code
This dashboard created by the HDMA Center displays number of accumulated COVID-19 cases by San Diego County zip code. Pop up charts show the growth of COVID-19 in each zip code over time.
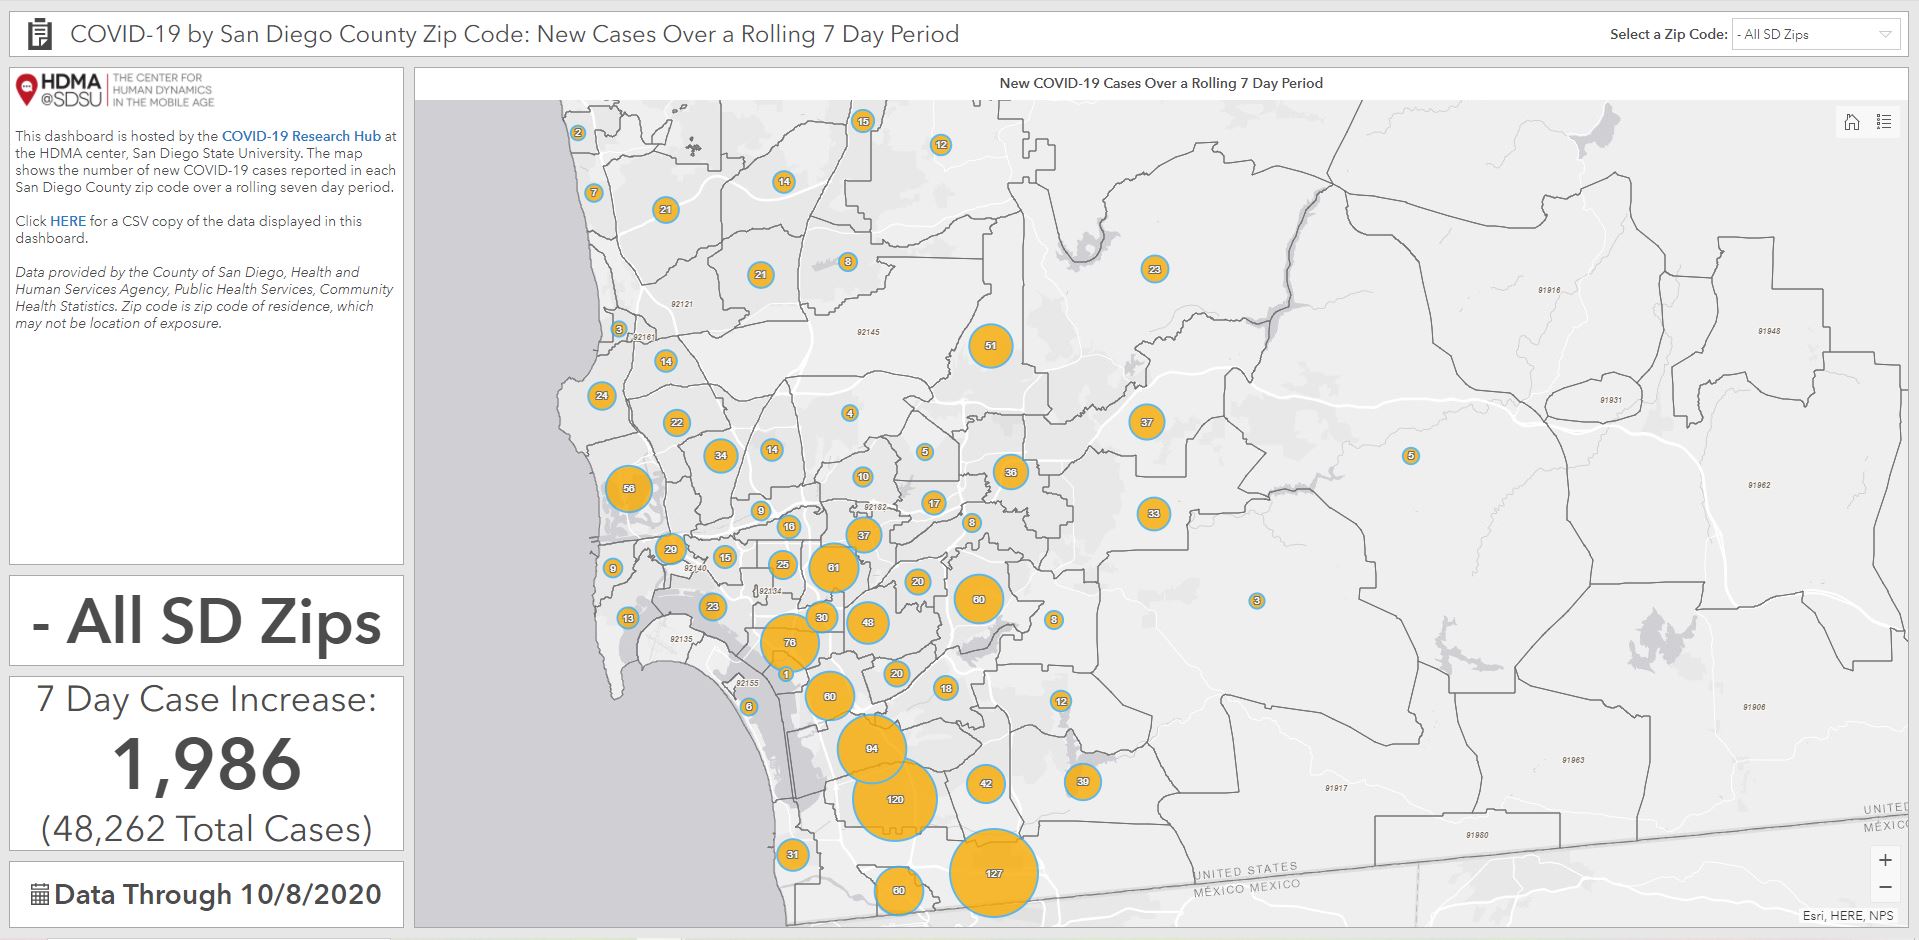
7-Day COVID-19 Cases in San Diego County
This mobile-friendly dashboard created by the HDMA Center looks at the number of new COVID-19 cases by zip code in San Diego County over a 7-day period (Wednesday - Tuesday).
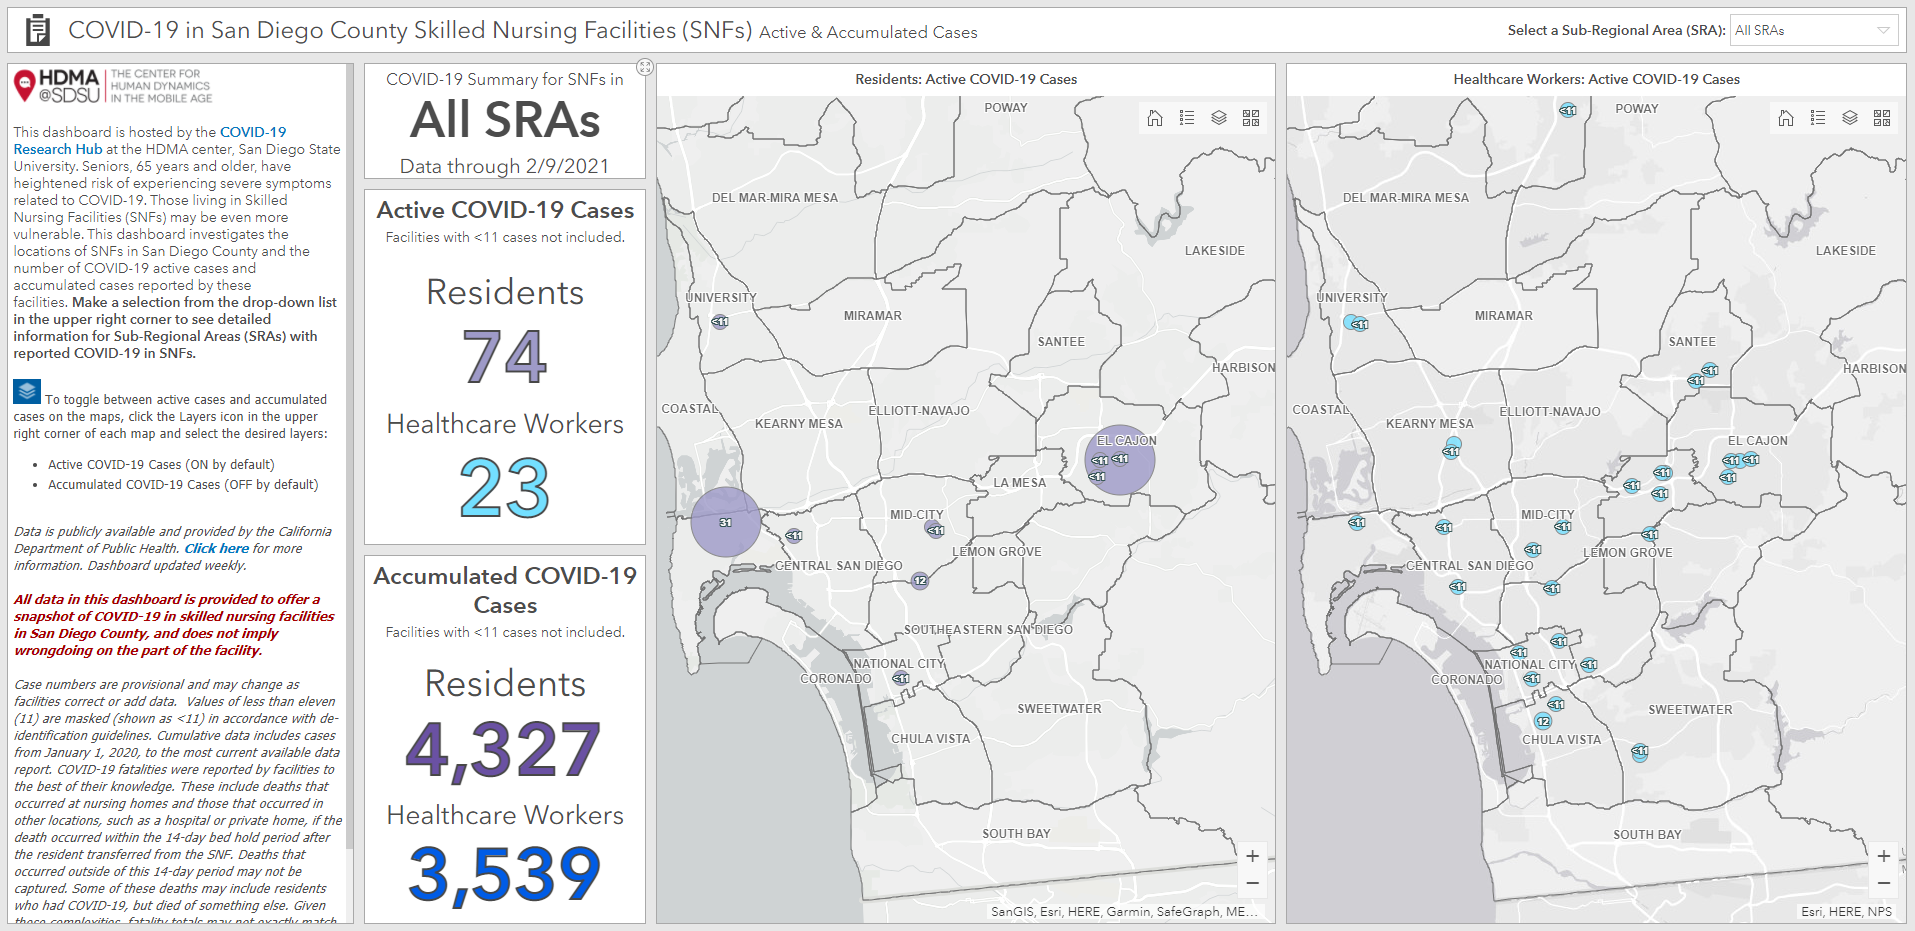
COVID-19 in San Diego County Skilled Nursing Facilities
The HDMA Center has created a dashboard that looks at the number of active and accumulated COVID-19 cases among residents and healthcare workers in skilled nursing facilities in the County of San Diego.

San Diego COVID-19 Risk Zones Analysis using Time-series Data
Presentation slides by Dr. Ming-Hsiang Tsou on using time-series data in San Diego County to determine COVID-19 risk areas.
COVID-19 Risk Zones Analysis Presentation →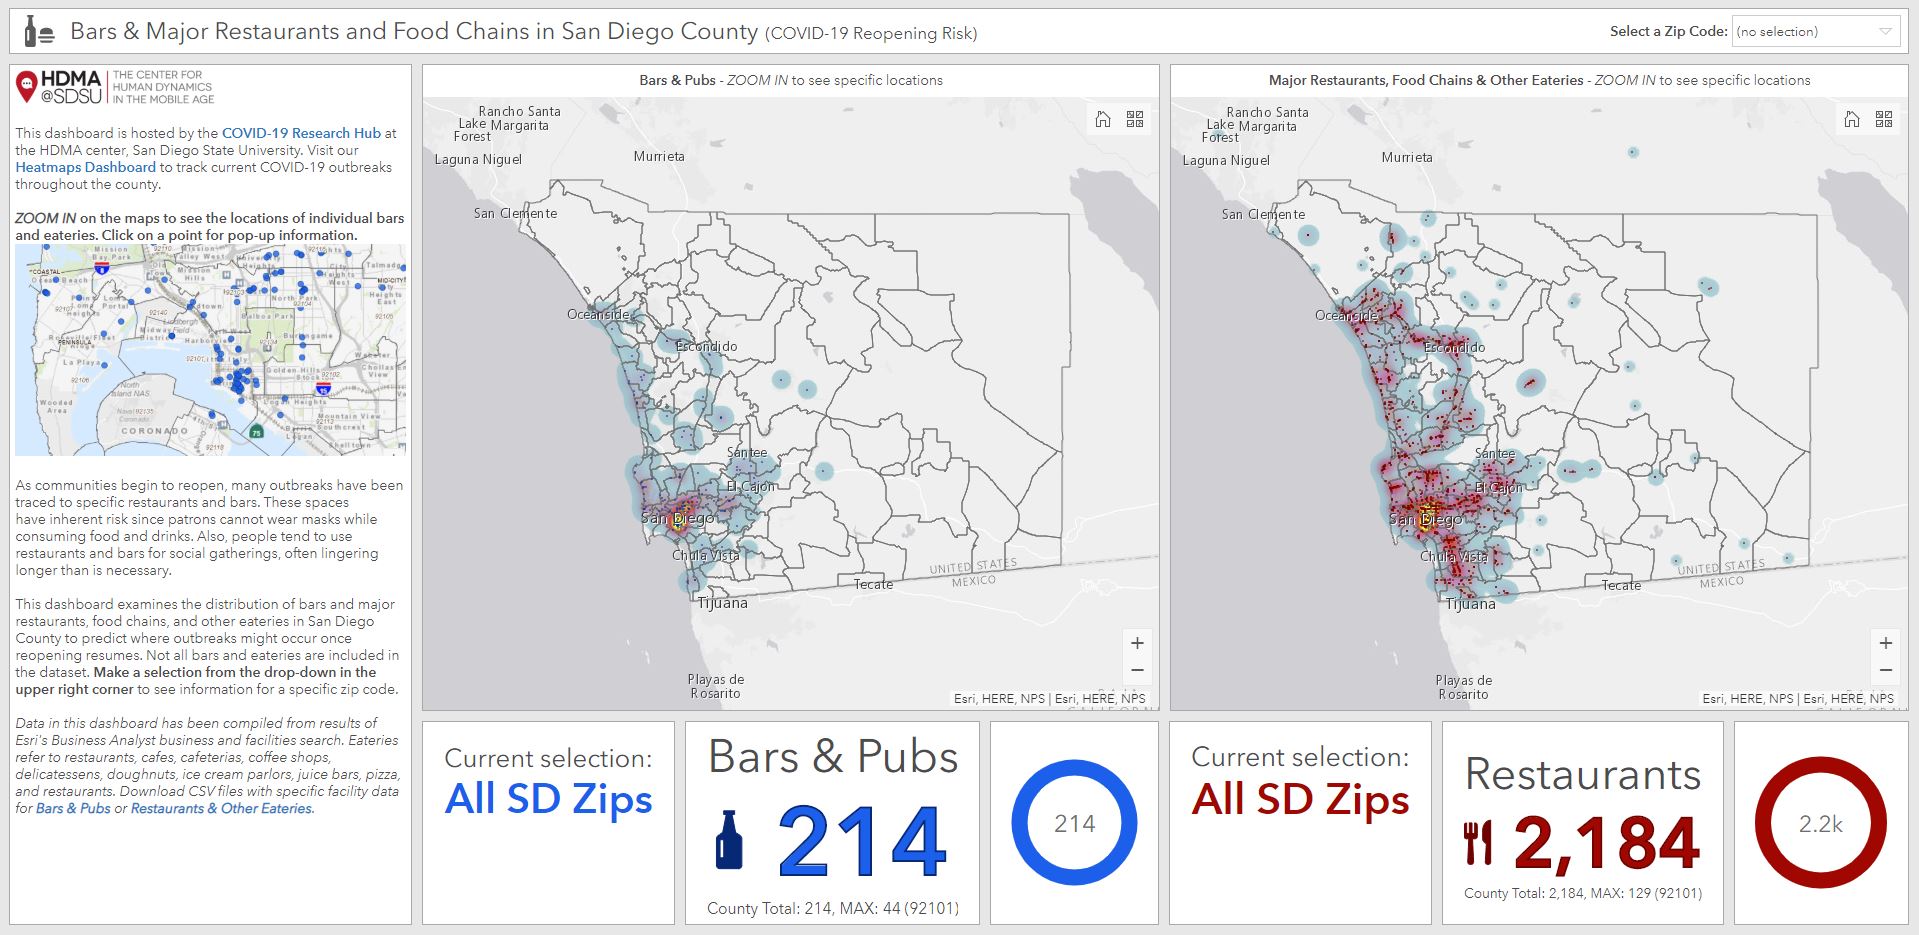
Bars, Major Restaurants, and Food Chains
The dashboard created by the HDMA Center examines the distribution of bars and major restaurants, food chains, and other eateries in San Diego County to predict where COVID-19 outbreaks might occur once reopening resumes.
The dashboard can be viewed here:
Bars and Restaurants Dashboard →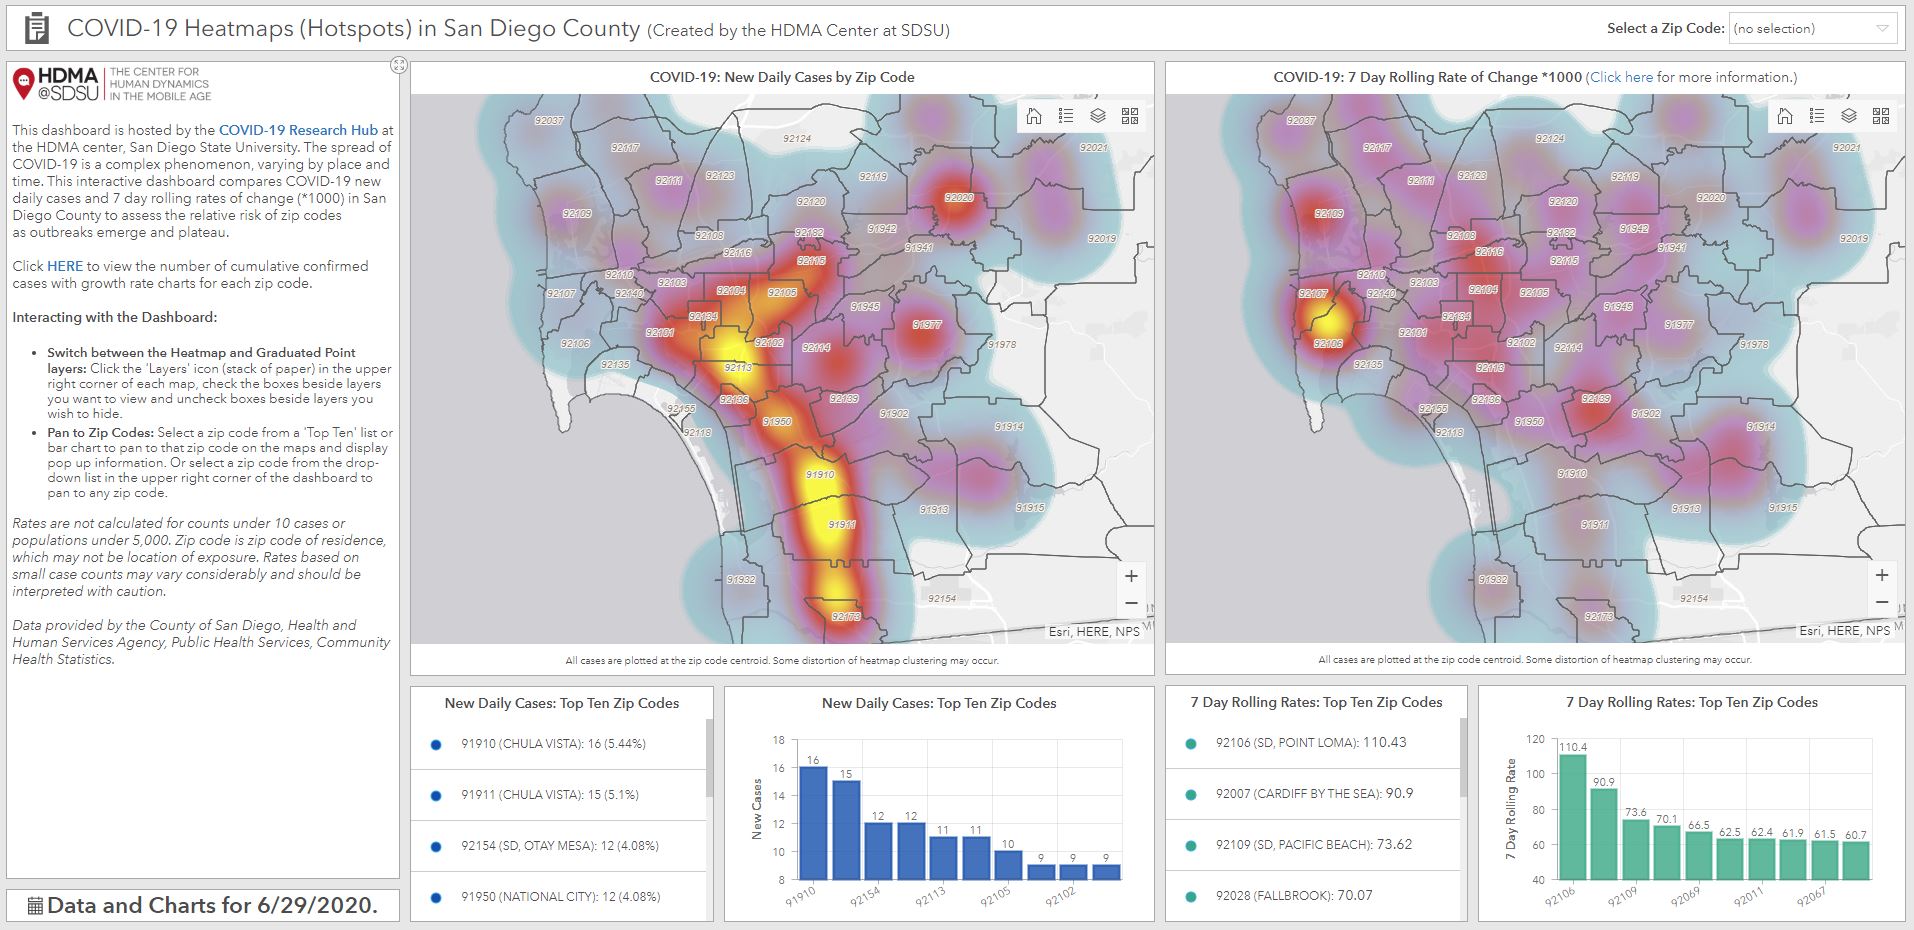
COVID-19 Heat Map Dashboard
This dashboard has been retired. Data last updated on June 29, 2021.
The interactive dashboard created by the HDMA Center compares COVID-19 new daily cases and 7-day rolling rates of change in San Diego County to assess the relative risk of zip codes as outbreaks emerge and plateau.
The dashboard can be viewed here:
COVID-19 Heat Map Dashboard →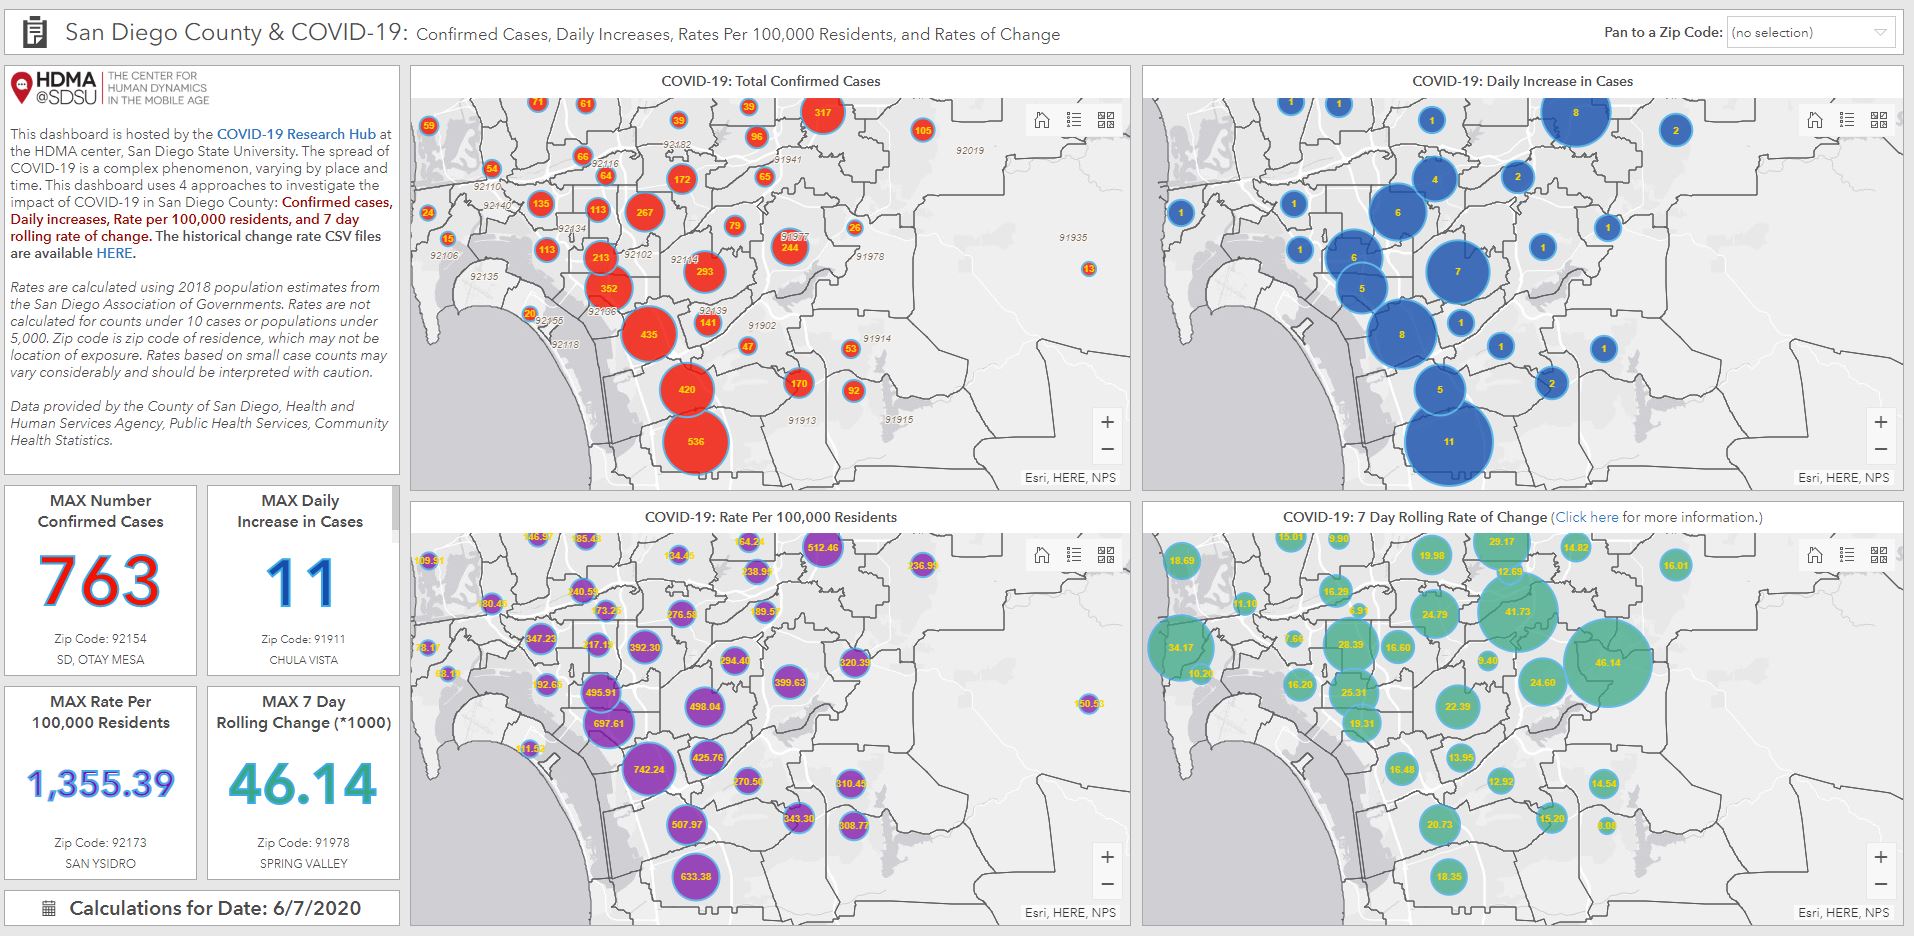
COVID-19 Daily New Cases and Change Rate Dashboard
This dashboard has been retired. Data last updated on June 29, 2021.
The dashboard created by the HDMA Center displays 4 interactive tiles investigating the impact of COVID-19 in San Diego County. It looks at confirmed cases, daily increases, rate per 100,000 residents, and the 7-day rolling rate of change.
The dashboard can be viewed here:
COVID-19 New Cases and Rates Dashboard →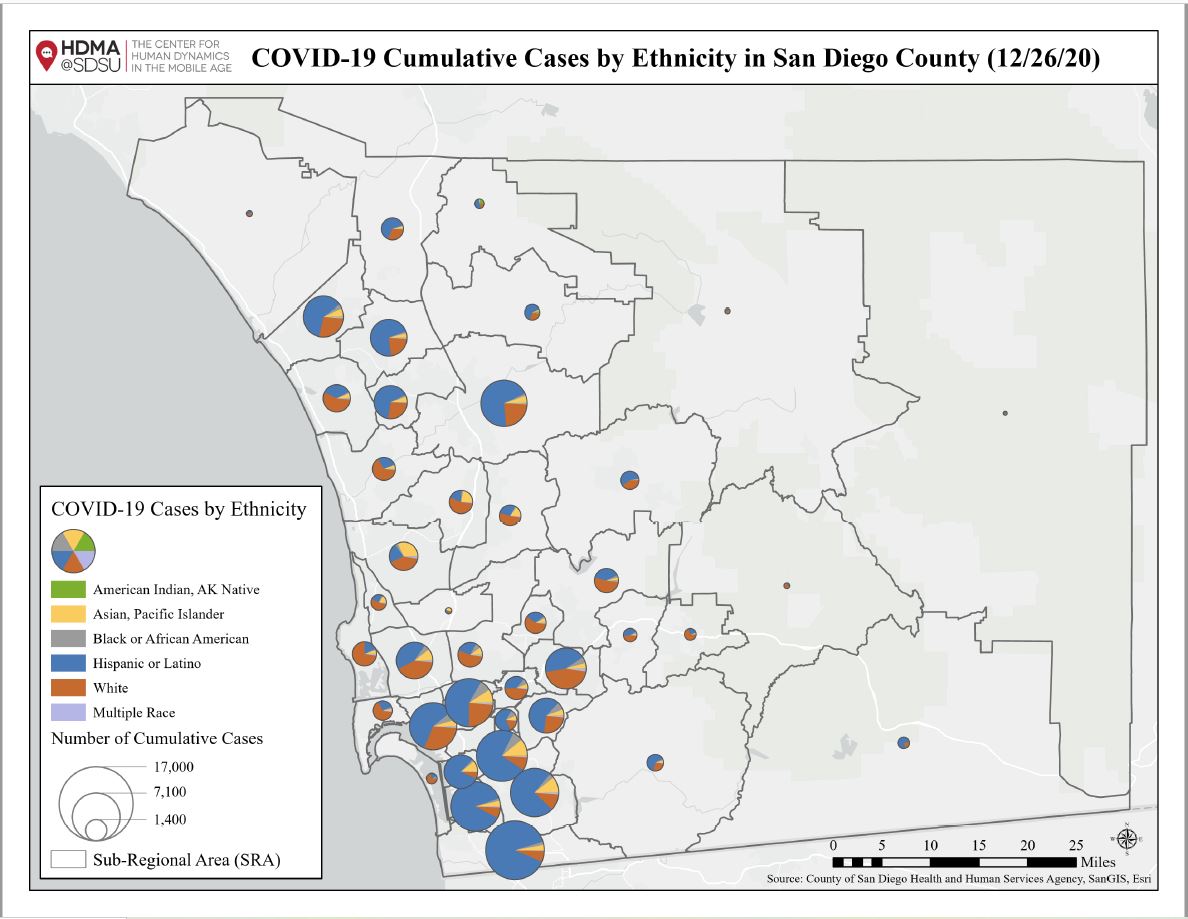
Cumulative COVID-19 Cases by Ethnicity in San Diego County
Data last updated on December 26, 2020.
The HDMA Center has created a document featuring maps displaying the COVID-19 cumulative cases by ethnicity in San Diego County from 5/20/20 to 12/26/20 in order to examine the populations vulnerable to COVID-19. The maps were created by Jessica Embury at the HDMA Center.
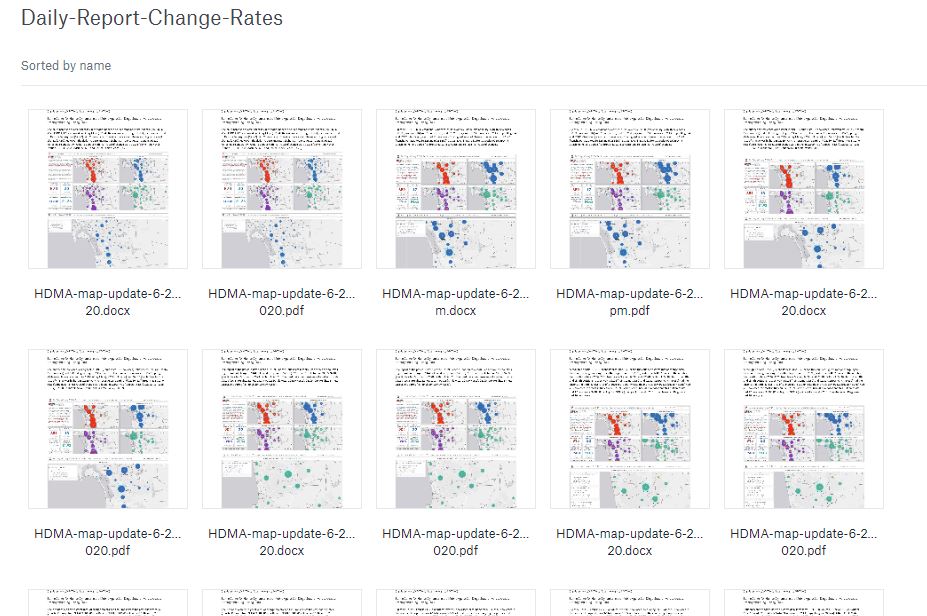
Daily Update Summaries for San Diego COVID-19 Outbreaks
Final update December 11, 2020.
The HDMA Center creates reports daily looking at the changes in new cases and change rates by zip code for San Diego County.
The summaries can accessed here:
Daily Update Summary Folder →